
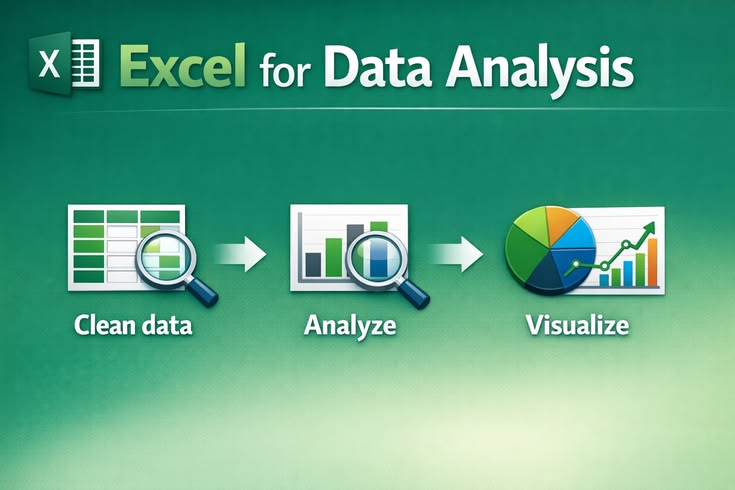
Excel Data Analysis Projects are practical projects where Microsoft Excel is used to organize, clean, analyze, visualize, and interpret data to answer business or real-world questions.
Rather than simply learning Excel formulas individually, an Excel Data Analysis Project allows you to combine several skills to solve a complete problem.
For example, instead of learning SUMIFS only as a formula, you could use it to determine which products generated the most revenue.
Instead of learning PivotTables simply because they are an Excel feature, you could use a PivotTable to analyze sales by product, month, location, or salesperson.
Instead of creating charts simply to make a spreadsheet attractive, you could use charts to communicate an important business trend.
This is what makes Excel Data Analysis Projects valuable for a portfolio.
They demonstrate how you apply Excel skills to a realistic problem.
Excel provides calculation capabilities, charts, PivotTables, and other tools that support data analysis and reporting.

Why Excel Data Analysis Projects Matter for Your Portfolio
Knowing Excel is useful, but employers and clients also want to see how you apply your skills.
A portfolio filled with practical Excel Data Analysis Projects can demonstrate your ability to work with data from beginning to end.
A strong Excel Data Analysis Project can show that you know how to:
- Organize raw data
- Clean inconsistent data
- Remove duplicates
- Handle missing values
- Create calculated fields
- Use Excel formulas
- Use lookup functions
- Build PivotTables
- Create PivotCharts
- Analyze trends
- Calculate KPIs
- Build dashboards
- Communicate insights
- Make recommendations
For example, someone can write “Excel” on a CV.
But a portfolio project can demonstrate:
“I cleaned a sales dataset, analyzed monthly revenue, identified the highest-performing products, created an interactive dashboard, and presented recommendations based on the findings.”
The second example provides much more evidence of practical ability.
Excel Data Analysis Projects You Can Build
There are many different Excel Data Analysis Projects you can create.
The best projects are those that give you an opportunity to solve realistic problems while demonstrating skills that are relevant to data analysis.
Here are 15 project ideas ranging from beginner-friendly projects to more advanced Excel Data Analysis Projects.
1. Sales Performance Analysis Project
A sales analysis project is one of the most practical Excel Data Analysis Projects you can add to a portfolio.
Imagine that a company has thousands of sales records but management does not know which products, locations, or salespeople are producing the strongest results.
Your task is to analyze the data and provide answers.
Dataset fields could include:
- Order ID
- Order date
- Product
- Product category
- Customer
- Location
- Quantity
- Unit price
- Revenue
- Salesperson
- Profit
Questions your Excel Data Analysis Project could answer
- What is total revenue?
- Which products generate the most revenue?
- Which products sell the most units?
- Which salesperson generates the highest revenue?
- Which month has the highest sales?
- Which location performs best?
- Which product categories are declining?
- What is the average order value?
- What percentage of revenue comes from each category?
Excel skills demonstrated
You could use:
SUMSUMIFSCOUNTIFSAVERAGEIFS- PivotTables
- PivotCharts
- Conditional formatting
- Slicers
- Charts
- Dashboard design
Microsoft describes PivotTables as tools for summarizing, analyzing, exploring, filtering, and presenting data, making them particularly useful for this type of project.
2. Excel Sales Dashboard Project
A dedicated Excel Sales Dashboard Project can take your sales analysis to another level.
Instead of presenting dozens of worksheets, you can create one interactive dashboard that summarizes important information.
Your dashboard could include:
Total Revenue
Total Orders
Total Profit
Units Sold
Average Order Value
Then add visualizations such as:
- Monthly revenue trend
- Revenue by product
- Sales by location
- Top 10 products
- Sales by salesperson
- Profit by category
You can also add filters for:
- Year
- Month
- Location
- Product category
- Salesperson
Excel supports PivotCharts and interactive filtering controls that can help users explore different subsets of data.
This makes an interactive dashboard one of the most useful Excel Data Analysis Projects for demonstrating both analytical and visualization skills.
3. Customer Analysis Excel Project
Customer analysis is another excellent choice for Excel Data Analysis Projects.
Create a dataset containing customer transactions.
Possible fields include:
- Customer ID
- Customer location
- Order date
- Product
- Category
- Quantity
- Amount spent
- Number of purchases
Then analyze customer behavior.
Your project could identify:
- Highest-value customers
- Most frequent customers
- Average customer spending
- Repeat customers
- Customers with declining activity
- Most popular products
- Revenue by customer location
Example portfolio question
Which customers contribute the most revenue, and how frequently do they purchase?
You can then create a customer dashboard that allows the viewer to filter customers by location, category, or purchase period.
4. Inventory Analysis Project
Inventory management provides another realistic use case for Excel Data Analysis Projects.
Imagine a retailer with hundreds of products.
Management needs to know which products are selling quickly and which products have remained in stock for too long.
Dataset fields
- Product ID
- Product name
- Category
- Current stock
- Units sold
- Reorder level
- Supplier
- Unit cost
- Inventory value
Questions to answer
- Which products have low inventory?
- Which products sell fastest?
- Which products are slow-moving?
- Which products need to be reordered?
- What is the total inventory value?
- Which category contains the most inventory?
You could use conditional formatting to highlight products below their reorder level.
This project demonstrates how Excel Data Analysis Projects can support operational decision-making.
5. Financial Analysis Excel Project
Financial analysis can make a strong addition to an intermediate or advanced portfolio.
Create a fictional company’s financial dataset containing:
- Monthly revenue
- Cost of goods sold
- Operating expenses
- Marketing expenses
- Administrative expenses
- Gross profit
- Net profit
- Profit margin
Then analyze financial performance over time.
Questions your Excel Data Analysis Project can answer
- Is revenue increasing?
- Are expenses growing faster than revenue?
- Which month generated the highest profit?
- What is the average profit margin?
- Which expense category consumes the largest amount of money?
- How has profitability changed over time?
You can turn the analysis into a financial dashboard.
6. Marketing Campaign Analysis Project
Marketing data is another excellent source for Excel Data Analysis Projects.
Create a dataset containing information about several marketing campaigns.
Example fields
- Campaign name
- Marketing channel
- Impressions
- Clicks
- Leads
- Conversions
- Advertising cost
- Revenue
You can calculate:
Click-through rate
Clicks ÷ Impressions × 100
Conversion rate
Conversions ÷ Leads × 100
Return on advertising spend
Revenue ÷ Advertising Cost
You can then compare campaigns.
For example:
Which campaign generated the most revenue relative to its advertising cost?
This gives your project a clear business question rather than making it simply a collection of Excel charts.
7. Employee Performance Analysis
Human resources data can also be used to create meaningful Excel Data Analysis Projects.
Create a fictional employee dataset containing:
- Employee ID
- Department
- Job role
- Monthly target
- Actual performance
- Attendance
- Performance score
- Years of experience
Then investigate employee and department performance.
Possible questions
- Which department has the highest average performance?
- Which employees exceed their targets?
- What percentage of employees meet their targets?
- Which departments have lower performance?
- Is attendance associated with performance?
- How does performance change over time?
You can present the findings using an HR analytics dashboard.
8. Student Performance Analysis
Student performance is another beginner-friendly topic for Excel Data Analysis Projects.
Create a fictional dataset containing:
- Student ID
- Course
- Attendance
- Assignment score
- Test score
- Examination score
- Final grade
Then analyze the results.
Questions to investigate
- What is the average score?
- Which subject has the highest average performance?
- What percentage of students passed?
- Which students require additional academic support?
- Is attendance associated with academic performance?
The project demonstrates that Excel Data Analysis Projects do not have to focus exclusively on sales.
You can apply data analysis to education, finance, healthcare, marketing, retail, HR, and many other areas.
9. E-Commerce Data Analysis Project
E-commerce provides a rich environment for Excel Data Analysis Projects.
Create a fictional online store dataset containing:
- Order ID
- Customer
- Product
- Category
- Location
- Order date
- Quantity
- Discount
- Revenue
- Shipping cost
- Profit
Analyze:
- Best-selling products
- Most profitable products
- Revenue by location
- Monthly sales
- Average order value
- Discount patterns
- Shipping costs
- Profit by category
Your final deliverable could be an interactive e-commerce Excel dashboard.
10. Personal Finance Analysis Project
If you are a beginner, a personal finance project can be one of the easiest Excel Data Analysis Projects to start with.
Use fictional data containing monthly expenses.
Categories could include:
- Food
- Transportation
- Education
- Utilities
- Housing
- Entertainment
- Savings
- Other expenses
Then analyze:
- Total monthly expenses
- Average spending
- Spending by category
- Highest expense categories
- Monthly spending trends
- Percentage of income spent
You can use formulas, PivotTables and charts to create a simple financial dashboard.
11. Nigerian Business Sales Analysis Project
Learners in Nigeria can make their Excel Data Analysis Projects more locally relevant by using realistic Nigerian business scenarios.
For example, create a fictional retail company operating in:
- Port Harcourt
- Lagos
- Abuja
- Enugu
- Ibadan
- Benin City
Analyze:
- Revenue by city
- Product performance
- Monthly sales
- Customer demand
- Profit margins
- Operating costs
You could investigate a question such as:
Which locations generate the most revenue, and which locations have the highest operating costs?
The dataset should be clearly identified as fictional or synthetic if it does not represent an actual business.
This is an effective way to demonstrate that you understand how data analysis can be applied to business situations relevant to Nigeria.
12. Excel Power Query Data Cleaning Project
Not every Excel Data Analysis Project needs to focus on dashboards.
You can create a project specifically around data cleaning and transformation.
Start with a messy dataset containing:
- Duplicate records
- Missing values
- Inconsistent names
- Incorrect date formats
- Extra spaces
- Different spellings
- Incorrect data types
Then use Power Query to transform the dataset.
Document your process
Raw Data → Cleaning → Transformation → Final Dataset
Explain each transformation and why it was necessary.
This is particularly valuable because a large part of practical data analysis involves preparing data before analyzing it.
13. Customer RFM Analysis Project
If you want to create a more advanced Excel Data Analysis Project, consider customer RFM analysis.
RFM stands for:
- Recency — How recently the customer purchased
- Frequency — How often the customer purchases
- Monetary — How much the customer spends
You can use these measures to categorize customers.
For example:
- High-value customers
- Loyal customers
- New customers
- At-risk customers
- Inactive customers
This project demonstrates analytical thinking beyond basic totals and averages.
It can also help you demonstrate your ability to create calculated metrics and customer segments in Excel.
14. HR Analytics Excel Project
Create an HR dataset containing:
- Employee ID
- Department
- Job role
- Years of experience
- Salary
- Attendance
- Performance score
- Employment status
Then analyze:
- Employee turnover
- Average salary
- Workforce distribution
- Performance by department
- Attendance patterns
- Employee retention
Create an HR dashboard that summarizes the most important findings.
This can become one of several Excel Data Analysis Projects showing that you can apply analytical techniques across different business functions.
15. Business KPI Dashboard Project
A comprehensive KPI dashboard can become a strong advanced Excel Data Analysis Project.
Instead of focusing on only one metric, combine several areas.
Sales KPIs
- Revenue
- Orders
- Units sold
- Average order value
Customer KPIs
- Total customers
- New customers
- Repeat customers
Financial KPIs
- Gross profit
- Net profit
- Profit margin
Operational KPIs
- Inventory level
- Orders fulfilled
- Returns
The goal is to give a fictional management team a concise overview of business performance.
How to Choose the Right Excel Data Analysis Projects
You do not need to build every project on this list.
Instead, choose projects that demonstrate different abilities.
Beginner Portfolio
Start with:
- Personal Finance Analysis
- Student Performance Analysis
- Basic Sales Analysis
Intermediate Portfolio
Progress to:
- Customer Analysis
- Inventory Analysis
- Marketing Campaign Analysis
- Sales Dashboard
Advanced Portfolio
Then consider:
- Financial Performance Dashboard
- RFM Customer Segmentation
- Power Query Data Cleaning
- Business KPI Dashboard
This progression makes your Excel Data Analysis Projects more meaningful because each project can demonstrate a different level of skill.
What Every Excel Data Analysis Project Should Include
A good project should not simply be an Excel file.
It should tell the reader what you did and why.
1. Project Title
Example:
Retail Sales Performance Analysis Using Excel
2. Business Problem
Explain the question you are trying to answer.
Example:
Management wants to understand which products and locations are responsible for changes in monthly revenue.
3. Dataset
Explain:
- Where the data came from
- Number of rows
- Number of columns
- Important variables
- Whether the dataset is real or synthetic
4. Data Cleaning
Explain what you found and corrected.
Examples:
- Missing values
- Duplicate records
- Incorrect dates
- Inconsistent categories
5. Analysis
Explain the formulas, PivotTables, calculations, or other methods used.
6. Visualization
Show appropriate charts and dashboards.
7. Findings
Explain the most important discoveries.
8. Recommendations
Explain what a business could potentially do based on the results.
This structure turns your spreadsheet into a genuine Excel Data Analysis Project.
Excel Formulas to Demonstrate in Your Projects
Different Excel Data Analysis Projects give you opportunities to demonstrate different formulas.
Basic functions
SUMAVERAGECOUNTMINMAX
Conditional functions
IFIFSIFERROR
Conditional calculations
SUMIFSUMIFSCOUNTIFCOUNTIFSAVERAGEIFAVERAGEIFS
Lookup functions
XLOOKUPVLOOKUPINDEXMATCH
The goal is not to use as many formulas as possible.
The goal is to use the right formula to answer the question you are investigating.
Use PivotTables in Your Excel Data Analysis Projects
PivotTables are particularly useful when a dataset contains many records.
Suppose your sales data contains 20,000 transactions.
Instead of manually calculating sales for every product, you can summarize the information with a PivotTable.
For example:
| Product Category | Revenue | Units Sold |
|---|---|---|
| Electronics | ₦8,500,000 | 1,250 |
| Accessories | ₦4,200,000 | 2,400 |
| Office Products | ₦3,700,000 | 1,850 |
You could then filter the PivotTable by month, location, product, or salesperson.
Microsoft explains that PivotTables can summarize, filter, group, compare, and explore large amounts of data, while PivotCharts provide visual representations of those summaries.
Add Charts to Your Excel Data Analysis Projects
Charts help communicate patterns visually.
For example:
Line charts
Useful for:
- Revenue over time
- Monthly expenses
- Customer growth
- Sales trends
Column charts
Useful for:
- Comparing products
- Comparing departments
- Comparing locations
Bar charts
Useful for:
- Ranking products
- Top customers
- Salespeople
Pie or doughnut charts
Can be useful for simple composition comparisons when there are only a few categories.
PivotCharts
Useful when you want the chart to respond to PivotTable filtering.
Microsoft’s Excel guidance also supports combining charts, PivotTables, slicers and conditional formatting to create dashboard-style reports.
Build Interactive Excel Data Analysis Projects
An interactive project can make your portfolio more impressive because the viewer can explore the data rather than only looking at a static screenshot.
For example, create an Excel sales dashboard with:
Year Filter → Location Filter → Category Filter → Salesperson Filter
Then display:
Revenue → Profit → Orders → Units Sold
Below the KPIs, show:
- Monthly sales trend
- Product performance
- Regional performance
- Top customers
This demonstrates not only Excel knowledge but also an understanding of how information should be presented to decision-makers.
Use Power Query in Advanced Excel Data Analysis Projects
As your Excel skills improve, introduce Power Query into your projects.
Power Query can help with:
- Importing data
- Cleaning datasets
- Combining files
- Removing duplicates
- Changing data types
- Splitting columns
- Replacing values
- Transforming data
For example, imagine that a company receives a new CSV sales file every month.
Instead of manually cleaning each file, you can create a repeatable transformation workflow.
That turns a simple Excel Data Analysis Project into a demonstration of data preparation and workflow efficiency.
Excel Data Analysis Projects Should Tell a Story
A portfolio project should follow a logical journey:
Raw Data → Cleaning → Analysis → Visualization → Insight → Recommendation
For example:
Raw Data
You receive 15,000 sales transactions.
Cleaning
You discover duplicate transactions and inconsistent product names.
Analysis
You calculate monthly revenue and product performance.
Visualization
You create a dashboard.
Insight
You discover that one product category contributes a large percentage of revenue but has declining sales.
Recommendation
You recommend that management investigate the decline and examine inventory, pricing, and marketing factors.
This is what separates useful Excel Data Analysis Projects from spreadsheets that simply contain formulas and charts.
How to Present Excel Data Analysis Projects in Your Portfolio
For every project, create a short case study.
Use this structure:
Project Name
Retail Sales Analysis Using Excel
Objective
Analyze sales performance and identify important trends.
Tools
Microsoft Excel, PivotTables, PivotCharts, Power Query and Excel formulas.
Process
Data cleaning → Transformation → Analysis → Visualization.
Key Findings
Summarize the most important discoveries.
Recommendations
Explain what actions the fictional business could consider.
Deliverables
- Excel workbook
- Dashboard
- Project documentation
- Dataset or dataset source
This format makes it easier for someone viewing your portfolio to understand your analytical thinking.
Excel Data Analysis Projects for Beginners
If you are completely new to Excel data analysis, do not start with the most complicated project.
Begin with a small dataset.
For example:
Project: Monthly Expense Analysis
Step 1
Create a table containing:
- Date
- Category
- Description
- Amount
Step 2
Clean the data.
Step 3
Calculate total expenses.
Step 4
Calculate spending by category.
Step 5
Create a monthly trend chart.
Step 6
Build a simple dashboard.
Step 7
Write three findings.
This small project teaches the basic workflow behind larger Excel Data Analysis Projects.
Excel Data Analysis Projects for Intermediate Learners
Once you understand basic formulas and charts, increase the complexity.
Good intermediate projects include:
- Sales analysis
- Customer analysis
- Inventory analysis
- Marketing campaign analysis
- Employee performance analysis
- Financial analysis
Introduce:
- PivotTables
- PivotCharts
- Slicers
- XLOOKUP
- SUMIFS
- COUNTIFS
- Power Query
The goal should be to solve increasingly realistic problems.
Excel Data Analysis Projects for Advanced Learners
Advanced learners can create projects involving:
- Multiple related datasets
- Power Query
- Data Models
- Power Pivot
- Complex KPIs
- Customer segmentation
- Forecasting
- Scenario analysis
- Interactive dashboards
Excel supports data analysis across multiple tables through its Data Model functionality, while Power Pivot can be used for more sophisticated data modeling and calculations.
You can therefore build projects that go beyond simple spreadsheet calculations.
How Potenmunia Tech School Approaches Excel Data Analysis Projects
At Potenmunia Tech School in Port Harcourt, practical learning can connect Excel concepts with realistic data analysis tasks.
Instead of treating Excel as a collection of formulas to memorize, learners can work through projects involving:
Data Cleaning → Excel Formulas → PivotTables → Analysis → Visualization → Dashboard → Business Insights
For example, a learner could begin with a raw sales dataset and gradually transform it into a structured analytical report.
The one-on-one learning model provides another practical element. Learners can work with a dedicated instructor who can provide individualized feedback while they develop their projects.
The focus can extend beyond completing the spreadsheet to understanding how to explain the project, document findings, present insights, and develop portfolio evidence.
For learners preparing for data analytics opportunities in Port Harcourt, Nigeria, this project-oriented approach can help connect Excel practice with broader data analyst skills.
Common Mistakes to Avoid in Excel Data Analysis Projects
1. Copying Tutorials Without Understanding Them
Tutorials are useful for learning.
But your portfolio should eventually demonstrate your own problem-solving ability.
After completing a tutorial, try applying the technique to a different dataset.
2. Creating Too Many Charts
A dashboard with 20 charts is not necessarily better than one with five useful visualizations.
3. Ignoring Data Cleaning
Do not immediately create charts from raw data.
Check for:
- Duplicates
- Missing values
- Incorrect dates
- Inconsistent categories
- Incorrect data types
4. Focusing Only on Appearance
A beautiful dashboard with weak analysis is still a weak project.
The analysis should come first.
5. Not Explaining Your Findings
Do not expect the viewer to interpret everything themselves.
Write a short explanation of the most important discoveries.
6. Using Synthetic Data Without Saying So
If your dataset is fictional, clearly state that it is synthetic.
This makes your portfolio more transparent.
How Many Excel Data Analysis Projects Should You Have?
You do not need dozens.
Three to five well-developed Excel Data Analysis Projects can provide a strong starting point.
For example:
Project 1
Sales Performance Analysis
Project 2
Customer Analysis
Project 3
Financial Analysis
Project 4
Inventory Analysis
Project 5
Interactive Excel Dashboard
The projects should demonstrate different skills rather than repeating the same analysis five times.
Excel Data Analysis Projects and Your Broader Data Analytics Career
Excel can be a useful part of a broader data analytics learning path.
You may eventually combine Excel with:
Excel → SQL → Power BI → Python → Advanced Analytics
The exact tools required depend on the role.
However, Excel projects can help you develop foundational analytical habits:
- Asking analytical questions
- Cleaning data
- Calculating metrics
- Identifying patterns
- Creating visualizations
- Explaining findings
- Making recommendations
Once you learn these concepts in Excel, you can begin applying similar thinking with other technologies.
Frequently Asked Questions About Excel Data Analysis Projects
What are the best Excel Data Analysis Projects for beginners?
Good beginner projects include personal finance analysis, student performance analysis, basic sales analysis, and simple inventory analysis.
These projects allow you to practice formulas, charts, PivotTables, and basic data visualization.
How many Excel Data Analysis Projects should I have in my portfolio?
Three to five strong projects are a good starting point. Focus on variety, clear documentation, realistic problems, and meaningful findings.
Can Excel Data Analysis Projects help me build a data analyst portfolio?
Yes. Practical projects can demonstrate your ability to clean, analyze, visualize, and communicate information using Excel.
What should an Excel Data Analysis Project contain?
A strong project should contain a problem statement, dataset description, data-cleaning process, analysis, visualizations, findings, and recommendations.
Can beginners create Excel Data Analysis Projects?
Absolutely. Start with simple datasets and gradually introduce more advanced formulas, PivotTables, dashboards, and Power Query.
Should I use real data for Excel projects?
You can use real public datasets when their licensing and usage terms permit it. Synthetic datasets can also work well, especially when you clearly label them as fictional.
What Excel skills should a data analyst learn?
Useful skills include formulas, lookup functions, conditional calculations, PivotTables, charts, data cleaning, dashboards, Power Query, and, for more advanced work, data modeling.
Can I create Excel Data Analysis Projects using Nigerian business scenarios?
Yes. You can create projects around fictional Nigerian retail, banking, education, logistics, marketing, telecommunications, or other business scenarios. Clearly distinguish synthetic data from real business data.
Is Excel still useful for data analysis?
Yes. Excel continues to provide tools for calculations, charts, PivotTables, data analysis, and dashboard-style reporting. Microsoft also provides dedicated analysis features and tools for exploring trends and patterns.
Where can I learn more about Microsoft Excel?
For general background information about Microsoft Excel, its development, capabilities, and history, you can explore Wikipedia.
Conclusion on Excel Data Analysis Projects
Excel Data Analysis Projects can transform your Excel knowledge from a list of skills into practical evidence of what you can actually do.
Instead of simply writing “Microsoft Excel” on your CV, create projects that show how you use Excel to solve problems.
Start with a simple project such as personal finance or sales analysis. Then progress to customer analysis, inventory management, financial reporting, Power Query transformations, customer segmentation, and interactive dashboards.
The strongest Excel Data Analysis Projects generally follow a clear analytical process:
Problem → Data → Cleaning → Analysis → Visualization → Insight → Recommendation
That process is more important than simply creating a complicated spreadsheet.
As your skills develop, combine your Excel projects with SQL, Power BI, Python, and other data analytics projects. This can help you build a portfolio that demonstrates not only your technical skills but also your ability to think about data, communicate findings, and solve practical problems.
For learners in Port Harcourt and across Nigeria, building practical Excel Data Analysis Projects can be a useful step toward developing a broader data analytics portfolio and preparing for real-world analytical work, click the link to learn more https://www.potenmuniatechschool.com