Machine Learning for Beginners is a practical starting point for anyone who wants to understand how computers can learn from data, identify patterns, and make predictions. Although machine learning is an important part of modern artificial intelligence, beginners do not need to start with complicated mathematics, advanced programming, or complex neural networks.
If you are searching for Machine Learning for Beginners, the most important thing to understand is that machine learning is a gradual learning process. You can start with basic programming, learn how data works, understand simple algorithms, and then progress toward more advanced artificial intelligence applications.
For a student, graduate, professional, entrepreneur, or aspiring technology specialist in Port Harcourt or elsewhere in Nigeria, learning machine learning can provide a useful foundation for exploring data science, artificial intelligence, and other technology fields.
This Machine Learning for Beginners guide explains what machine learning means, how it works, the major types of machine learning, what beginners should learn first, useful tools, practical projects, career opportunities, and how to develop machine learning skills through hands-on practice.
Machine learning is a field of artificial intelligence in which computer systems learn patterns from data and use those patterns to make predictions, classifications or decisions.
A traditional computer program generally follows instructions written by a programmer.
Machine learning works differently.
Instead of writing a separate rule for every possible situation, a developer can provide data and an appropriate learning algorithm. The algorithm can identify patterns in the data and produce a model that can be used with new information.
For a beginner, this can be simplified as:
Data → Algorithm → Training → Model → Prediction
According to Wikipedia, machine learning focuses on algorithms that can learn from data and generalise their behaviour to previously unseen data. You can read more about the subject on Wikipedia’s Machine Learning page.
A Simple Machine Learning Example
Imagine a business has several years of sales records.
The data may contain:
Product name
Product category
Price
Number of units sold
Date
Location
Promotion information
A machine learning model could learn relationships between these variables and sales.
The business could then use the model to help estimate future demand.
This is one of the easiest ways for Machine Learning for Beginners students to understand the concept: the computer learns from examples rather than relying entirely on manually written rules.
Why Should Beginners Learn Machine Learning?
There are several reasons people become interested in Machine Learning for Beginners training.
Machine learning is connected to:
Artificial intelligence
Data science
Data analytics
Software development
Business intelligence
Automation
Predictive analytics
Computer vision
Natural language processing
Machine learning is also increasingly relevant to how modern software applications process and interpret data.
For beginners, however, the goal should not simply be to learn a fashionable technology.
The goal should be to develop the ability to solve problems using data and computational methods.
One of the most important topics in Machine Learning for Beginners is understanding the major types of machine learning.
Supervised Learning
Supervised learning uses labelled examples.
The model receives input data together with known outcomes.
For example, suppose you have historical property data containing property characteristics and known selling prices.
The model can learn the relationship between the characteristics and the prices.
Two common supervised learning tasks are:
Regression
Classification
Regression
Regression is used when the target is a numerical value.
Examples include:
Predicting sales
Estimating property prices
Forecasting demand
Estimating delivery times
Classification
Classification is used when the model needs to assign observations to categories.
Examples include:
Spam or not spam
Customer churn or no churn
Approved or not approved
Category A, B or C
Unsupervised Learning
Unsupervised learning works with data without predefined target labels.
The objective may be to discover structures or groups within the data.
A common example is customer segmentation.
Suppose a business has thousands of customers.
A clustering algorithm could help identify groups of customers with similar purchasing patterns.
Scikit-learn describes clustering as the automatic grouping of similar objects into sets and provides several clustering algorithms.
Reinforcement Learning
Reinforcement learning involves an agent interacting with an environment and learning from feedback.
The agent receives rewards or penalties and attempts to improve its behaviour over time.
Reinforcement learning is more advanced than what most people need at the beginning of their Machine Learning for Beginners journey, so it is usually better to understand supervised and unsupervised learning first.
Machine Learning for Beginners: What Should You Learn First?
If you are starting Machine Learning for Beginners, you do not need to learn everything at once.
A structured learning path is much easier to manage.
Start With Computer Fundamentals
Understand:
Files and folders
Operating systems
Basic software concepts
Internet fundamentals
Basic troubleshooting
How programming environments work
If you already have these skills, you can move quickly to programming.
A beginner does not need hundreds of software tools.
A practical starting toolkit could include:
Python
Used for programming and machine learning development.
Jupyter Notebook
Useful for combining code, explanations, results and visualisations in an interactive environment.
NumPy
Useful for numerical computing.
Pandas
Useful for data manipulation and analysis.
Matplotlib
Useful for creating visualisations.
Scikit-learn
Scikit-learn provides many traditional machine learning algorithms as well as tools for preprocessing, model evaluation and model selection.
Git and GitHub
Version-control tools can help you organise projects and share your work.
For Machine Learning for Beginners, the important thing is not to install every tool available. Learn a small set properly and expand your toolkit when your projects require it.
Practical Machine Learning Projects for Beginners
Projects are one of the most effective ways to turn Machine Learning for Beginners theory into practical skills.
1. House Price Prediction
Use information such as:
Property size
Number of rooms
Location
Property age
Build a model that predicts a numerical price.
This introduces regression.
2. Customer Classification
Use customer information to predict whether a customer belongs to a particular category.
This introduces classification.
3. Customer Segmentation
Use purchasing behaviour to group customers.
This introduces clustering.
4. Sales Forecasting
Analyse historical sales information and build a model that attempts to estimate future sales.
This can help learners understand how machine learning can connect to business problems.
5. Student Performance Analysis
Use an appropriate educational dataset to investigate patterns related to student outcomes.
The emphasis should be on responsible interpretation rather than treating predictions as certain outcomes.
Machine Learning for Beginners in Nigeria
Machine learning education can be particularly interesting when learners connect technical concepts to Nigerian problems.
Nigeria has businesses and organisations working across many sectors, including:
Banking
Telecommunications
Agriculture
Logistics
Retail
Education
Energy
Healthcare
Financial technology
These sectors can generate large amounts of data.
For example, a learner could build a project around:
Retail: Predicting product demand.
Agriculture: Analysing crop or weather-related datasets.
Business: Segmenting customers based on purchasing behaviour.
The purpose of these projects is not necessarily to build a production system immediately. They provide a practical environment for learning how data, algorithms and decision-making fit together.
Machine Learning for Beginners in Port Harcourt
For learners in Port Harcourt, the same principles apply.
Whether you are a university student, recent graduate, professional or someone changing careers, start by developing a strong foundation.
Rather than focusing only on certificates, learners should also consider what they can actually demonstrate.
For example, after completing a beginner machine learning programme, you should ideally be able to explain:
What problem your project solves
Where the data came from
How you cleaned the data
Which algorithm you selected
Why you selected it
How you evaluated the model
What the results mean
What limitations the project has
That ability to explain your work is valuable.
How Potenmunia Tech School Approaches Machine Learning
Potenmunia Tech School approaches technology education with an emphasis on practical learning and career preparation.
For Machine Learning for Beginners, a practical approach means learners should not spend all their time listening to theory. They should have opportunities to work with data, practise programming, experiment with machine learning techniques and build projects.
The approach can include:
100% Practical, Hands-On Learning
Learners practise concepts through exercises and projects rather than relying exclusively on lectures.
Real-World Projects and Capstone Experience
Projects give learners an opportunity to connect machine learning concepts to realistic problems.
Portfolio Building
A completed project can be documented and added to a portfolio to demonstrate practical ability.
Mentorship
Guidance can help beginners understand difficult concepts, troubleshoot problems and develop better learning habits.
Career and Job Readiness
Machine learning skills can be developed alongside broader professional skills, helping learners understand how technical knowledge can translate into workplace opportunities.
AI Integration and Future Skills
Machine learning sits within the broader artificial intelligence ecosystem. Learners can gradually explore modern AI concepts after developing foundational skills.
Innovation and Entrepreneurship
Machine learning can also be approached as a problem-solving tool. Learners can explore how data and AI can contribute to products, services and technology-based solutions.
For anyone researching Machine Learning for Beginners in Port Harcourt, the key question should not only be where to study. Ask what you will actually practise and what evidence of your learning you will have when the programme ends.
Common Mistakes in Machine Learning for Beginners
1. Starting With Advanced AI
Many beginners immediately want to learn deep learning, generative AI or neural networks.
These are interesting fields, but fundamentals matter.
Start with Python, data and basic machine learning.
2. Ignoring Data Cleaning
A sophisticated algorithm cannot automatically fix every data-quality problem.
Learn how to inspect and prepare data properly.
3. Memorising Algorithms
Knowing the names of 30 algorithms is less useful than understanding when to use five appropriate ones.
4. Copying Tutorials
Tutorials are useful for learning.
However, after following a tutorial, modify the project or create your own project so you can demonstrate independent understanding.
5. Building Projects Without Explaining Them
A portfolio should not simply contain code.
Explain the problem, methodology, results and limitations.
6. Ignoring Model Evaluation
A prediction is not automatically reliable.
Learn how to select appropriate evaluation metrics and interpret the results.
Artificial intelligence is the broader field concerned with creating systems capable of performing tasks associated with intelligent behaviour.
Machine learning is one important approach within AI.
A simplified relationship is:
Artificial Intelligence → Machine Learning → Deep Learning
This is an oversimplification because AI includes approaches that are not machine learning, but it provides a useful starting point for beginners.
Why Practical Experience Matters
Reading about machine learning is useful.
Watching tutorials is useful.
Taking notes is useful.
But practical experience brings these pieces together.
Suppose you learn about classification.
You might understand the definition after reading it.
But building a classification project forces you to answer practical questions:
What is the target?
What are the features?
Is the data clean?
Which algorithm should I try?
How should I split the data?
Which metric should I use?
Why did the model make these predictions?
This is where Machine Learning for Beginners becomes a real technical skill rather than simply a collection of definitions.
Conclusion on Machine Learning for Beginners
Machine Learning for Beginners is not about becoming an artificial intelligence expert overnight.
It is about building a solid foundation.
Start with Python. Learn how data works. Understand statistics. Practise data analysis. Study fundamental machine learning algorithms. Build projects. Evaluate your models. Document your work. Then gradually move toward more advanced areas.
For learners in Port Harcourt and Nigeria, there is also an opportunity to apply machine learning to problems that are relevant to local businesses, organisations and communities.
If you are considering structured training, look for a programme that gives you opportunities to practise, build projects, receive mentorship and develop a portfolio.
Potenmunia Tech School in Port Harcourt provides a practical technology-learning environment where learners can develop technical competence through hands-on work, projects, mentorship and career-focused preparation.
You do not have to understand everything before you begin.
Start with the fundamentals, practise consistently and let each project teach you something new.
Frequently Asked Questions About Machine Learning for Beginners
What is Machine Learning for Beginners?
Machine Learning for Beginners is the study of basic machine learning concepts, programming skills, data preparation, algorithms and practical projects designed for people who are new to the field.
Can a complete beginner learn machine learning?
Yes. A complete beginner can learn machine learning by starting with programming and data fundamentals and gradually progressing toward machine learning algorithms and projects.
Do I need Python for machine learning?
Python is not the only programming language used for machine learning, but it is a very practical starting point because of its extensive ecosystem for data analysis and machine learning.
Do I need mathematics for Machine Learning for Beginners?
Basic mathematics and statistics are useful when starting. More advanced machine learning eventually requires deeper knowledge of areas such as probability, linear algebra and calculus.
What should I learn before machine learning?
A useful foundation includes Python programming, basic statistics, data analysis and data visualisation.
What machine learning algorithms should beginners learn?
Start with fundamental algorithms such as linear regression, logistic regression, decision trees, random forests, k-nearest neighbours and k-means clustering.
What is the best way to learn machine learning?
Combine theory with practice. Learn a concept, apply it to a dataset, build a small project and explain what you discovered.
Can I learn machine learning in Port Harcourt?
Yes. Learners in Port Harcourt can use self-study, online resources, structured training and project-based learning to develop machine learning skills.
What machine learning projects can beginners build?
Beginners can build projects involving sales prediction, customer segmentation, classification, house-price prediction, demand forecasting and other suitable datasets.
Is machine learning the same as AI?
No. Artificial intelligence is a broader field, while machine learning is one approach used within artificial intelligence.
Is machine learning the same as data science?
No. Data science covers a broader collection of activities involving data, including analysis, statistics, visualisation and sometimes machine learning.
Can machine learning skills lead to a technology career?
Machine learning knowledge can contribute to career paths such as data science, machine learning engineering, AI engineering, data analysis and other technology roles. The skills required vary by position.
What tools should Machine Learning for Beginners students learn?
A useful starting toolkit includes Python, NumPy, Pandas, Matplotlib, Jupyter Notebook and Scikit-learn. Scikit-learn provides tools for several common machine learning workflows, including classification, regression, clustering, preprocessing and model evaluation.
If you’ve been searching for the top project management programs in Nigeria, you’ve probably noticed the same problem everywhere: long lists of course names with no real explanation of what separates a good program from a forgettable one. This article looks at the top project management programs in Nigeria from a different angle not just naming them, but explaining what actually makes a project management program worth your time and money, so you can judge any option (including ones not listed here) for yourself.
According to Wikipedia, project management is the process of leading a team’s work to achieve project goals within defined constraints such as scope, time, and budget. That definition is simple, but the gap between knowing it and being able to do it is exactly what separates weak training from strong training and it’s the main thing to evaluate when comparing the top project management programs in Nigeria.
The strongest project management programs in Nigeria build three layers of competence, not just one:
Technical knowledge — scoping a project, building a timeline, managing a budget, and using tools like Trello, Asana, Jira or Microsoft Project.
Methodology fluency — understanding Agile, Scrum, Waterfall, and PRINCE2, and knowing when each applies.
Soft skills under pressure — stakeholder communication, conflict resolution, and decision-making when a project starts to slip.
Many courses that market themselves among the top project management programs in Nigeria focus almost entirely on the first layer. That’s a large part of why some certified project managers still struggle in their first real role — they know the theory but haven’t practiced running an actual project from kickoff to delivery.
Why Project Management Is a Growing Career Path in Nigeria
Nigerian employers across construction, telecoms, logistics, tech startups and NGOs increasingly need people who can own a project end-to-end. Remote and hybrid work has also opened international project management roles to Nigerians who can demonstrate real capability — which is part of why interest in the top project management programs in Nigeria keeps climbing year over year.
What to Look for When Comparing Programs
Before ranking any program among the top project management programs in Nigeria, check it against these four things:
Practical, project-based learning
Look for programs where you actually plan and run a project even a simulated one rather than only studying case studies.
Recognized certifications vs. skills-based training
Certifications like PMP and CAPM from the Project Management Institute carry global recognition, but PMP requires documented project hours, and both are exam-heavy with limited hands-on practice. Skills-based training focuses on building your ability to actually do the job, which matters more if you’re starting without prior project experience.
Mentorship and career support
A program with CV review, interview preparation and job application guidance shortens the gap between finishing a course and getting hired.
Cohort vs. one-on-one learning
Cohort learning offers peer interaction and shared momentum. One-on-one learning offers pacing tailored to your background and direct feedback on your specific weak points.
Types of Programs You’ll Find Among the Top Project Management Programs in Nigeria
University and postgraduate diploma programs
Thorough but time-intensive (often a year or more), and generally more theoretical than practical.
Global certification-prep courses (PMP, CAPM, PRINCE2)
Best suited to people who already have project experience and want formal validation, not to complete beginners.
Practical, career-focused training schools
Prioritize hands-on project work, portfolio building and job readiness over exam preparation — usually the better fit for beginners and career-changers.
Free and low-cost online options
Useful for exploring the field, but they rarely include the mentorship or job-readiness support that turns knowledge into an actual offer.
At Potenmunia Tech School in Port Harcourt, project management training is built around the idea that you should leave able to run a project, not just describe one. Each learner is paired with a dedicated instructor, so the pace and focus adjust to your background — someone moving from an admin role works through different examples than someone from a technical field.
Sessions are hands-on rather than lecture-first: learners work through real project scenarios, practice using tools like Trello and Asana, and build a portfolio piece that demonstrates their planning and execution skills to employers. The program includes structured interview preparation and CV support, and learners can choose either the one-on-one path or a cohort setting depending on what suits them.
A Simple Framework for Choosing Among the Top Project Management Programs in Nigeria
Do I already have project experience, or am I starting from zero? If from zero, prioritize practical, project-based training over exam-prep courses.
Do I need a specific certification for my target role or industry? Check the exact prerequisites (PMP requires documented project hours) before committing time.
How much individual feedback do I need to build confidence? If you learn best with direct correction, look for one-on-one options.
Does the program help me get hired, or just help me finish a course? Ask specifically whether CV support, interview prep and job application guidance are included.
Frequently Asked Questions
What makes a program one of the top project management programs in Nigeria?
A combination of hands-on project work, credible methodology training, and real career support — not just a certificate at the end.
Do I need a certification like PMP to work as a project manager in Nigeria?
Not always. Many employers prioritize demonstrated ability over formal certification, particularly for entry-level and mid-level roles.
Can I become a project manager without a technical background?
Yes. Project management is a transferable skill set built on organization, communication and decision-making.
How long does it take to become job-ready in project management?
It varies, but a practical, project-based course focused on job readiness can typically prepare a motivated beginner in a few months.
Is one-on-one training better than cohort-based training?
Neither is universally better — it depends on your learning style and how much individual feedback you need.
If you are learning SQL and want to build practical data analytics skills, SQL Data Analysis Projects are one of the best ways to move beyond tutorials and start solving realistic problems.
Learning SQL syntax is important, but knowing how to use SQL to answer business questions is even more valuable. A well-designed SQL Data Analysis Project gives you an opportunity to work with datasets, investigate patterns, clean information, combine tables, calculate metrics, and communicate findings.
For beginners, SQL Data Analysis Projects can cover simple areas such as sales and customers before progressing to more advanced topics such as financial transactions, e-commerce, marketing, employee performance, customer segmentation, and business intelligence.
You do not need a massive database to begin. A small, well-structured dataset can provide enough information to create a meaningful SQL Data Analysis Project.
This guide explores practical SQL Data Analysis Projects for beginners, the SQL skills they develop, how to structure them, and how to turn your projects into portfolio pieces that demonstrate your data analysis ability.
SQL Data Analysis Projects are practical projects where SQL is used to investigate and analyze data stored in relational databases.
Instead of learning SQL commands separately, you use them together to answer specific analytical questions.
For example, a sales SQL Data Analysis Project might ask:
What is the company’s total revenue?
Which products generate the most revenue?
Which products sell the most units?
Which customers spend the most?
Which locations generate the highest sales?
What are the monthly sales trends?
Which months perform better than others?
The purpose of a SQL Data Analysis Project is not simply to produce SQL queries. The purpose is to use SQL to transform raw records into useful information.
A typical project follows this process:
Business problem → Dataset → SQL queries → Analysis → Findings → Recommendations
That workflow makes SQL Data Analysis Projects particularly useful for people preparing for data analyst careers.
Why SQL Data Analysis Projects Matter for Beginners
There is a major difference between knowing SQL commands and being able to use SQL for analysis.
A beginner may know how to write:
SELECT *
FROM sales;
But a data analyst needs to answer questions such as:
Which products generated the most revenue during the last six months, and what does that tell the business?
That requires more than basic syntax.
SQL Data Analysis Projects Build Practical Skills
When you build SQL Data Analysis Projects, you repeatedly practice:
Data exploration
Data filtering
Aggregation
Sorting
Grouping
Table joins
Conditional logic
Date analysis
Data cleaning
Subqueries
CTEs
Window functions
Business interpretation
The more projects you complete, the easier it becomes to recognize which SQL technique is appropriate for a particular problem.
SQL Data Analysis Projects Strengthen Your Portfolio
One of the biggest benefits of SQL Data Analysis Projects is that they can become evidence of your practical skills.
Instead of simply writing:
“I know SQL.”
You can show:
“I used SQL to analyze customer transactions, identify high-value customers, calculate monthly revenue, and generate business recommendations.”
That difference can make your portfolio more informative.
SQL Data Analysis Projects Improve Analytical Thinking
Data analysis is not just about writing code.
You need to decide:
What problem needs to be solved?
What information is required?
Which tables contain that information?
How should the data be transformed?
What patterns are important?
What do the results actually mean?
SQL Data Analysis Projects give you repeated opportunities to practice this way of thinking.
Below are practical SQL Data Analysis Projects that beginners can use to develop their skills.
1. SQL Sales Data Analysis Project
A sales analysis project is one of the most useful SQL Data Analysis Projects for beginners.
Imagine a company has a database containing:
Order ID
Customer ID
Product ID
Product name
Quantity
Unit price
Order date
Sales location
Your objective is to understand the company’s sales performance.
Questions for the SQL Data Analysis Project
You could investigate:
What is the total revenue?
What are the top-selling products?
Which products generate the most revenue?
Which customers spend the most?
Which locations generate the highest revenue?
What are monthly sales?
What is the average order value?
How many orders were completed?
Which products have declining sales?
A simple query might be:
SELECT
    product_name,
    SUM(quantity * unit_price) AS total_revenue
FROM sales
GROUP BY product_name
ORDER BY total_revenue DESC;
This SQL Data Analysis Project teaches you how to combine calculations with aggregation and grouping.
Skills Practiced
You can practice:
SELECT
SUM()
GROUP BY
ORDER BY
Calculated columns
Business metrics
Date analysis
Nigerian Example
You could create a fictional sales database for a Nigerian retail business operating in Port Harcourt, Lagos, Abuja, and other cities.
You could then investigate which locations and products generate the most revenue.
2. SQL Customer Analysis Project
Customer analysis is another excellent category of SQL Data Analysis Projects.
Suppose you have a database containing customer information and transaction history.
You can investigate customer purchasing behavior.
Questions to Explore
Your SQL Data Analysis Project could answer:
Who are the highest-value customers?
How much has each customer spent?
How many orders has each customer made?
Which customers purchase most frequently?
Which customers have not purchased recently?
What is the average customer spending?
Which customer segments generate the most revenue?
For example:
SELECT
    customer_id,
    COUNT(order_id) AS total_orders,
    SUM(amount) AS total_spent
FROM orders
GROUP BY customer_id
ORDER BY total_spent DESC;
This project can later be expanded into customer segmentation.
Customer Segmentation
You could classify customers into categories such as:
High-value
Medium-value
Low-value
New customers
Returning customers
This introduces more advanced SQL Data Analysis Project techniques such as CASE, CTEs, and window functions.
3. SQL E-Commerce Data Analysis Project
E-commerce provides excellent opportunities for SQL Data Analysis Projects because an online store can have several connected tables.
For example:
Customers
Contains:
Customer ID
Name
Location
Registration date
Products
Contains:
Product ID
Product name
Category
Price
Orders
Contains:
Order ID
Customer ID
Order date
Order status
Order Items
Contains:
Order ID
Product ID
Quantity
Unit price
This structure gives you opportunities to practice SQL JOINs.
Questions for the Project
You can investigate:
Which products are most popular?
Which categories generate the most revenue?
Which customers purchase most frequently?
What is the average order value?
Which products are rarely purchased?
Which months have the highest order volume?
Which categories are growing?
Example:
SELECT
    p.category,
    SUM(oi.quantity * oi.unit_price) AS revenue
FROM order_items oi
JOIN products p
    ON oi.product_id = p.product_id
GROUP BY p.category
ORDER BY revenue DESC;
This is a strong SQL Data Analysis Project because it demonstrates that you understand relationships between tables.
4. SQL Employee Data Analysis Project
Employee data can be used to create a practical SQL Data Analysis Project around workforce analytics.
Imagine an employee database containing:
Employee ID
Department
Job title
Salary
Location
Employment date
Performance score
Questions to Analyze
You could investigate:
How many employees work in each department?
What is the average salary by department?
Which departments have the highest average performance?
How many employees joined each year?
Which roles have the highest average salary?
Which departments have the highest employee turnover?
For example:
SELECT
    department,
    AVG(salary) AS average_salary,
    COUNT(employee_id) AS employee_count
FROM employees
GROUP BY department
ORDER BY average_salary DESC;
This project demonstrates how SQL can be used for human resources analytics.
5. SQL Financial Data Analysis Project
Financial transactions can provide another strong SQL Data Analysis Project.
You could create a fictional transaction database containing:
Transaction ID
Customer ID
Transaction date
Transaction type
Amount
Branch
Account type
Transaction status
Questions to Answer
Your project could investigate:
What is the total transaction value?
What is the average transaction amount?
Which transaction types are most common?
Which branches process the most transactions?
How many transactions occur each month?
What percentage of transactions fail?
How does transaction activity change over time?
This can help beginners practice aggregation, filtering, conditional calculations, and date-based analysis.
For Nigerian learners, a fictional fintech or retail-payment dataset can make the SQL Data Analysis Project more familiar while avoiding the use of private financial information.
6. SQL Marketing Data Analysis Project
Marketing data can be transformed into another useful SQL Data Analysis Project.
Imagine a marketing database containing:
Campaign ID
Campaign name
Channel
Date
Impressions
Clicks
Conversions
Revenue
You can analyze campaign performance.
Questions to Answer
Which campaign generated the most conversions?
Which channel generated the highest revenue?
What is the conversion rate?
Which campaigns performed poorly?
Which campaign generated the highest revenue?
How did performance change over time?
A basic analysis might look like:
SELECT
    campaign_name,
    SUM(impressions) AS impressions,
    SUM(clicks) AS clicks,
    SUM(conversions) AS conversions,
    SUM(revenue) AS revenue
FROM campaigns
GROUP BY campaign_name
ORDER BY revenue DESC;
You can make the SQL Data Analysis Project more advanced by calculating conversion rates and comparing marketing channels.
7. SQL Inventory Data Analysis Project
Inventory management is another realistic business problem.
A fictional inventory database could contain:
Product ID
Product name
Category
Quantity in stock
Reorder level
Supplier
Unit cost
Last restock date
Questions for Your SQL Data Analysis Project
You could investigate:
Which products are running low?
Which products have excess inventory?
Which suppliers provide the most products?
What is the total inventory value?
Which products require immediate restocking?
Which categories have the highest inventory value?
For example:
SELECT
    product_name,
    quantity_in_stock,
    reorder_level
FROM inventory
WHERE quantity_in_stock <= reorder_level;
This project introduces beginners to SQL filtering and business decision-making.
8. SQL Healthcare Data Analysis Project
Healthcare data can also provide a meaningful SQL Data Analysis Project when using fictional or appropriately public datasets.
You might create tables containing:
Patient ID
Age group
Gender
Visit date
Department
Diagnosis category
Treatment type
Possible Questions
How many patients visited each department?
Which departments received the most visits?
What are the most common diagnosis categories?
How does patient volume change monthly?
Which age groups have the highest number of visits?
For educational projects, use fictional or properly anonymized datasets and avoid including personally identifiable information.
9. SQL Student Performance Analysis Project
Students learning SQL can create a database representing an educational institution.
Tables might include:
Student ID
Course
Department
Score
Semester
Attendance
Grade
Questions to Analyze
What is the average score by course?
Which courses have the highest failure rates?
Which students have the highest overall performance?
Does performance vary by semester?
Which departments have the highest average scores?
This is a straightforward SQL Data Analysis Project for beginners because the business questions are easy to understand.
10. SQL Customer Retention Analysis Project
Once you have completed basic SQL Data Analysis Projects, customer retention is a good next challenge.
The goal is to determine whether customers continue using a product or service over time.
You might investigate:
Number of new customers
Returning customers
Repeat purchase rate
Customer activity by month
Customer retention patterns
Customers who became inactive
This type of SQL Data Analysis Project introduces more advanced analytical thinking.
You may need:
Date functions
CTEs
Subqueries
Window functions
Conditional logic
SQL Data Analysis Projects Using Different SQL Techniques
A strong SQL portfolio should demonstrate more than basic SELECT statements.
SQL Data Analysis Projects With GROUP BY
GROUP BY is one of the most important SQL techniques for analytics.
For example:
SELECT
    city,
    SUM(revenue) AS total_revenue
FROM sales
GROUP BY city;
This allows you to compare business performance across cities.
You can use this technique in SQL Data Analysis Projects involving:
Sales
Customers
Employees
Products
Marketing
Finance
SQL Data Analysis Projects Using JOINs
JOINs become important when your data is stored in multiple related tables.
For example:
SELECT
    c.customer_name,
    o.order_date,
    o.amount
FROM customers c
JOIN orders o
    ON c.customer_id = o.customer_id;
Projects using JOINs can demonstrate that you understand relational databases rather than only single-table analysis.
Good SQL Data Analysis Projects for practicing JOINs include:
E-commerce analysis
Customer analysis
Sales analysis
Banking analysis
Inventory analysis
Employee analysis
SQL Data Analysis Projects Using CASE Statements
CASE statements allow you to create categories based on conditions.
For example:
SELECT
    customer_id,
    total_spent,
    CASE
        WHEN total_spent >= 500000 THEN 'High Value'
        WHEN total_spent >= 200000 THEN 'Medium Value'
        ELSE 'Low Value'
    END AS customer_segment
FROM customer_summary;
This can be useful in SQL Data Analysis Projects involving:
Customer segmentation
Employee performance
Sales classification
Product performance
Financial analysis
SQL Data Analysis Projects Using CTEs
Common Table Expressions can make complex SQL Data Analysis Projects easier to organize.
For example:
WITH customer_sales AS (
    SELECT
        customer_id,
        SUM(amount) AS total_spent
    FROM sales
    GROUP BY customer_id
)
SELECT
    customer_id,
    total_spent
FROM customer_sales
WHERE total_spent > 200000
ORDER BY total_spent DESC;
CTEs can make your SQL easier to read and explain.
SQL Data Analysis Projects Using Window Functions
Window functions are especially useful when you want to compare records without collapsing the result into a single row per group.
Useful functions include:
ROW_NUMBER()
RANK()
DENSE_RANK()
LAG()
LEAD()
SUM() OVER()
AVG() OVER()
For example:
SELECT
    product_name,
    revenue,
    RANK() OVER (ORDER BY revenue DESC) AS revenue_rank
FROM product_sales;
This can rank products according to revenue.
A beginner does not need to start with window functions. However, adding them to later SQL Data Analysis Projects can demonstrate progression toward intermediate SQL skills.
SQL Data Analysis Projects for Portfolio Development
One of the biggest reasons to build SQL Data Analysis Projects is to create evidence of your ability.
Your portfolio should not simply contain SQL files.
Each project should tell a clear story.
What to Include in a SQL Project
A good project can contain:
1. Project Overview
Explain what the project is about.
2. Business Problem
Explain the problem you are trying to solve.
3. Dataset
Describe the tables, columns, and source.
4. Analytical Questions
List the questions you want to answer.
5. SQL Queries
Organize the queries clearly.
6. Findings
Explain the most important results.
7. Recommendations
Explain what the findings could mean for the business.
8. Limitations
Explain anything that could affect your conclusions.
9. Future Analysis
Explain what you would investigate next.
How to Create a Strong SQL Data Analysis Project From Scratch
Follow this framework when creating your own SQL Data Analysis Projects.
1. Choose a Topic
Pick an area you understand.
For example:
E-commerce Sales Analysis
2. Define the Business Problem
Write one clear problem statement.
Example:
The business wants to understand which products, customers, and locations contribute most to revenue.
3. Create Analytical Questions
Turn the problem into smaller questions.
For example:
What is total revenue?
Which products generate the most revenue?
Which customers spend the most?
Which locations perform best?
What are the monthly trends?
4. Explore the Database
Before writing complex queries, inspect the tables.
Understand:
Columns
Data types
Primary keys
Foreign keys
Relationships
Missing values
Duplicate records
5. Clean the Data
Look for:
NULL values
Duplicates
Incorrect dates
Inconsistent categories
Invalid numbers
Incorrect relationships
6. Write SQL Queries
Start with simple exploratory queries.
Then progress toward more advanced analysis.
7. Interpret Your Results
Do not stop after getting query output.
Ask:
What does this result tell me?
8. Document Everything
Create a README that allows another person to understand the entire SQL Data Analysis Project.
How to Make Your SQL Data Analysis Projects More Advanced
Once you understand the basics, you can improve your projects in several ways.
Add More Tables
Instead of one table, create related tables for:
Customers
Products
Orders
Payments
Locations
This gives you more opportunities to practice JOINs.
Add More Business Questions
Instead of answering five questions, create 10–15 related analytical questions.
Add Time-Based Analysis
Analyze:
Daily performance
Weekly performance
Monthly performance
Quarterly performance
Yearly performance
Add Customer Segmentation
Group customers according to:
Spending
Frequency
Recency
Number of purchases
Add Rankings
Rank:
Products
Customers
Locations
Employees
Campaigns
Add Data Quality Checks
Demonstrate that you can identify problems in the data before analyzing it.
SQL Data Analysis Projects and Other Analytics Tools
SQL is an important data analysis tool, but it does not have to work alone.
A more advanced portfolio project could follow this workflow:
SQL → Excel → Power BI
For example:
SQL extracts and transforms the data.
Excel can be used for additional calculations or quick exploration.
Power BI presents the findings through an interactive dashboard.
Another workflow could be:
SQL → Python → Visualization
Python can be used for more advanced analysis and automation.
The goal is to show that you understand how different tools fit into the overall analytics process.
SQL Data Analysis Projects for Beginners in Nigeria
Learners in Nigeria can create projects around familiar industries and business situations.
Potential project topics include:
Nigerian retail sales analysis
E-commerce customer analysis
Fintech transaction analysis
Logistics delivery analysis
Supermarket inventory analysis
Restaurant sales analysis
Telecommunications customer analysis
School performance analysis
Real estate property analysis
Marketing campaign analysis
For example, a learner in Port Harcourt could build a fictional retail SQL Data Analysis Project comparing sales across different locations.
The project could investigate:
Total revenue by location
Top-selling products
Customer spending
Monthly sales
Inventory levels
Repeat purchases
Using familiar business scenarios can make it easier to understand why the analysis matters.
When learning about technical concepts, databases, analytics terminology, or related subjects, reference resources can help you develop background knowledge.
For general reference and further reading, learners can explore Wikipedia, a free collaborative encyclopedia maintained by volunteers.
However, when creating a professional SQL Data Analysis Project, do not rely on Wikipedia alone for technical documentation or business data. For database-specific questions, it is better to consult the official documentation for the SQL database system you are using and document your dataset source clearly.
At Potenmunia Tech School in Port Harcourt, SQL learning can be connected to practical data analytics rather than being limited to memorizing SQL commands.
A learner can progress through a project-based workflow such as:
SQL fundamentals → database exploration → data cleaning → SQL analysis → insights → project documentation → portfolio development
The one-on-one learning model also allows learners to work with a dedicated instructor who can provide individualized feedback while they develop their projects.
This can be particularly useful when a beginner becomes stuck on a JOIN, struggles to understand a query result, or needs help turning technical results into a clear business explanation.
The objective is to help learners understand not only how to write SQL, but also how SQL fits into the wider process of solving data problems.
Projects can then contribute to a portfolio that demonstrates practical work.
For learners preparing for employment, the project process can also connect with CV development, interview preparation, and job application support.
Common Mistakes in SQL Data Analysis Projects
1. Choosing a Project That Is Too Complex
Your first SQL Data Analysis Project does not need hundreds of tables.
Start small.
2. Writing Queries Without Questions
Do not create random queries simply to demonstrate SQL syntax.
Start with analytical questions.
3. Ignoring Data Quality
Always investigate missing, duplicated, and inconsistent records.
4. Focusing Only on Technical SQL
A technically correct query does not automatically produce a useful insight.
Explain the business meaning.
5. Copying Projects Without Understanding Them
A portfolio project should demonstrate what you understand.
If you use a tutorial or public project as inspiration, modify it, extend the analysis, and clearly understand every query you present.
6. Creating Too Many Similar Projects
Five nearly identical sales projects will not demonstrate as much range as several projects covering different business problems.
Before publishing a SQL Data Analysis Project, check the following.
Dataset
I understand the dataset.
I understand the table relationships.
I checked for missing data.
I checked for duplicate records.
I documented the data source.
SQL
I used filtering.
I used aggregation.
I used GROUP BY.
I understand JOINs.
I used conditional logic where appropriate.
I can explain my queries.
I tested my results.
Analysis
I defined a clear business problem.
I created specific analytical questions.
I identified important findings.
My conclusions are supported by the data.
My recommendations are reasonable.
Portfolio
My README is clear.
My SQL code is organized.
My project has a clear objective.
My findings are easy to understand.
I can explain the project during an interview.
How Many SQL Data Analysis Projects Should a Beginner Build?
There is no magic number.
However, three to five well-developed SQL Data Analysis Projects can provide a useful starting portfolio.
For example:
SQL Sales Data Analysis Project
SQL Customer Segmentation Project
SQL E-Commerce Analysis Project
SQL Financial Transactions Project
SQL Marketing Analysis Project
As your skills improve, you can create more sophisticated projects involving CTEs, window functions, advanced date analysis, customer retention, and performance optimization.
The goal should be progression.
Your fifth SQL Data Analysis Project should ideally demonstrate skills that were not present in your first.
What Should Your First SQL Data Analysis Project Be?
If you are completely new to SQL, start with sales data.
A sales database is easy to understand and gives you many opportunities to practice important analytical techniques.
Start with:
Total sales
Number of orders
Average order value
Top products
Top customers
Sales by location
Monthly sales
Then gradually introduce:
JOINs
CASE statements
Subqueries
CTEs
Window functions
This creates a natural learning path from beginner SQL Data Analysis Projects to more advanced analytical work.
Frequently Asked Questions About SQL Data Analysis Projects
What are SQL Data Analysis Projects?
SQL Data Analysis Projects are practical projects where SQL is used to explore, clean, transform, and analyze data stored in databases to answer business or analytical questions.
What is the best SQL Data Analysis Project for beginners?
A sales analysis project is an excellent starting point because it allows beginners to practice filtering, grouping, aggregation, sorting, calculations, and eventually JOINs.
How many SQL Data Analysis Projects should I have in my portfolio?
Three to five well-developed projects are a reasonable starting point. Focus on quality, variety, documentation, and your ability to explain the analysis.
Can SQL Data Analysis Projects help me become a data analyst?
Yes. Projects can demonstrate practical SQL and analytical skills. They are particularly useful when you clearly explain the business problem, methodology, findings, and recommendations.
What SQL skills should I demonstrate in my projects?
Begin with SELECT, WHERE, ORDER BY, GROUP BY, aggregate functions, and JOINs. Then progress to CASE statements, subqueries, CTEs, date functions, and window functions.
Can I create SQL Data Analysis Projects without professional experience?
Yes. You can use public or synthetic datasets to simulate realistic business problems. Clearly explain the project’s purpose and dataset source.
Can I use Nigerian business scenarios in SQL projects?
Yes. Nigerian retail, fintech, e-commerce, logistics, education, healthcare, and other business scenarios can provide useful project themes. Use public, synthetic, or appropriately anonymized data.
Should SQL Data Analysis Projects include dashboards?
A dashboard is not mandatory for a SQL project, but combining SQL analysis with Excel, Power BI, or another visualization tool can make a portfolio project more comprehensive.
Can SQL Data Analysis Projects be used during job interviews?
Yes. Employers may ask you to explain your projects, SQL queries, analytical decisions, findings, and recommendations. You should understand every part of the project you present.
Conclusion on SQL Data Analysis Projects
SQL Data Analysis Projects can transform the way you learn SQL.
Instead of treating SQL as a collection of commands to memorize, projects give you a reason to use those commands.
Start with a simple sales analysis. Then progress to customer segmentation, e-commerce, inventory, finance, marketing, employee analytics, and customer retention.
As your skills develop, introduce JOINs, CTEs, subqueries, CASE statements, date functions, and window functions.
Most importantly, learn to think beyond the query.
A strong SQL Data Analysis Project should answer three questions:
What problem are you solving?
What does the data tell you?
What should someone do with that information?
That mindset will help you develop from someone who simply knows SQL into someone who can use SQL as part of a genuine data analytics workflow.
For learners in Port Harcourt and across Nigeria, building several practical SQL Data Analysis Projects can also provide valuable material for a professional portfolio. With consistent practice, feedback, mentorship, and exposure to real-world analytical scenarios, you can continue progressing toward broader data analytics skills and career opportunities.
Explore related resources on SQL, Excel, Power BI, Python, data visualization, and data analyst career development as you continue building your portfolio.
The Data Analyst Career Path in Nigeria has become an increasingly relevant option for students, graduates, career changers, and professionals who want to build practical technology skills. As organisations generate more information from customers, transactions, websites, mobile applications and business operations, the ability to understand and interpret data has become increasingly useful.
But what does the Data Analyst Career Path in Nigeria actually look like?
Do you need a computer science degree? Which skills should you learn first? Should you start with Excel, SQL, Power BI or Python? How do you gain experience when you have never worked as a data analyst? And how can someone move from a beginner to a professional analyst?
This guide answers those questions step by step.
According to the general definition of data analysis, it involves inspecting, cleaning, transforming, and modelling data to discover useful information and support decision-making. You can learn more about the broader concept of data analysis through Wikipedia.
For Nigerian learners, the Data Analyst Career Path in Nigeria is not simply about learning software. It involves developing technical skills, analytical thinking, business understanding, communication skills and practical experience.
The journey can begin with Excel and gradually progress through SQL, Power BI, statistics, Python, portfolio development and professional workplace skills.
What Is the Data Analyst Career Path in Nigeria?
The Data Analyst Career Path in Nigeria is the progression a learner can follow from acquiring basic data skills to becoming capable of performing professional data analysis.
A typical progression can look like:
Beginner → Excel Analyst → SQL Analyst → BI/Data Visualization Analyst → Junior Data Analyst → Data Analyst → Senior Data Analyst → Analytics Specialist or Manager
However, this is not a rigid career ladder.
Some people move into business intelligence. Others specialise in product analytics, marketing analytics, financial analytics, operations analytics or data science.
The important thing is to develop skills progressively.
The Data Analyst Career Path in Nigeria can therefore be viewed as a combination of:
Data literacy
Excel and spreadsheet analysis
SQL
Statistics
Data visualisation
Power BI or another BI platform
Python
Data cleaning
Business understanding
Communication
Portfolio development
Workplace experience
Continuous learning
Recent Nigerian career guides similarly emphasise Excel, SQL, visualisation, Python, projects and communication as important parts of preparing for data analyst work.
Why Is the Data Analyst Career Path in Nigeria Important?
Businesses in Nigeria operate with data every day.
Consider the amount of information generated by:
Banks
Fintech companies
Telecommunications companies
Supermarkets
Hospitals
Universities
Logistics companies
E-commerce businesses
Oil and gas companies
Insurance companies
Government agencies
Non-governmental organisations
Small and medium-sized businesses
A business might collect information about sales, customers, payments, expenses, employees, inventory, marketing campaigns or service usage.
Raw data alone does not automatically create value.
Someone needs to organise it, analyse it, identify patterns and communicate what those patterns mean.
That is where data analysts come in.
The Data Analyst Career Path in Nigeria therefore connects technology with business decision-making.
What Does a Data Analyst Do in Nigeria?
A data analyst works with data to help answer business or organisational questions.
Typical responsibilities may include:
Collecting data
Cleaning data
Checking data quality
Writing SQL queries
Analysing spreadsheets
Creating reports
Building dashboards
Identifying trends
Calculating key performance indicators
Presenting findings
Supporting business decisions
Automating repetitive analytical tasks
For example, imagine a retail business in Port Harcourt.
Management might ask:
Which products generated the highest revenue this quarter?
The analyst could:
Extract the sales data.
Remove duplicate records.
Correct inconsistent product names.
Group sales by product.
Calculate revenue.
Compare different periods.
Build a visual report.
Explain the findings.
Recommend possible actions.
That is data analysis in practice.
The Data Analyst Career Path in Nigeria: Step-by-Step
Understanding the stages of the Data Analyst Career Path in Nigeria can prevent beginners from becoming overwhelmed.
You do not have to learn every technology simultaneously.
A structured progression is usually more effective.
1. Develop Basic Data Literacy
The first stage of the Data Analyst Career Path in Nigeria is understanding data itself.
Before learning complicated tools, understand concepts such as:
What is data?
What is a dataset?
What is a variable?
What is a database?
What is a record?
What is a metric?
What is a KPI?
What is a trend?
What is an outlier?
What is data quality?
You should also understand basic numerical concepts.
These include:
Percentages
Ratios
Averages
Minimum and maximum values
Median
Growth rates
Percent changes
For example, if a company’s revenue increases from ₦1 million to ₦1.2 million, an analyst should understand that the business experienced a 20% increase.
The ability to interpret numbers is more important than simply calculating them.
Once you have developed spreadsheet and SQL skills, data visualisation becomes an important next step.
Power BI is one option for creating interactive business intelligence reports.
Microsoft’s current Power BI Data Analyst certification framework covers preparing data, modelling data, visualising and analysing data, and managing Power BI environments.
A learner should understand more than how to create colourful charts.
You should learn:
Data importing
Power Query
Data cleaning
Relationships
Data modelling
DAX fundamentals
Measures
KPIs
Dashboard design
Filters
Data storytelling
Example Power BI Project
Imagine a fictional logistics company operating between:
Port Harcourt
Lagos
Abuja
Enugu
Benin City
You could create a dashboard showing:
Number of deliveries
Delivery success rate
Average delivery time
Revenue
Customer locations
Monthly performance
This would demonstrate practical analytical thinking.
Python is another useful stage of the Data Analyst Career Path in Nigeria.
It does not necessarily have to be your first technical skill.
After developing Excel and SQL knowledge, Python can help you handle more advanced analytical tasks.
Important Python concepts for data analysts include:
Variables
Lists
Dictionaries
Loops
Functions
Conditional statements
File handling
Data manipulation
For data analysis, learners commonly encounter libraries such as:
Pandas
NumPy
Matplotlib
Pandas, in particular, is widely used for manipulating and analysing tabular data.
Python can help with:
Data cleaning
Automation
Exploratory analysis
Repetitive workflows
Larger datasets
Data transformation
The goal is not to become a software engineer.
The goal is to use programming to make analytical work more efficient and flexible.
7. Learn Data Cleaning
Data cleaning is one of the most important but frequently underestimated parts of the Data Analyst Career Path in Nigeria.
Real datasets may contain:
Missing values
Duplicate records
Incorrect spellings
Inconsistent dates
Incorrect data types
Invalid entries
Outliers
Inconsistent categories
Imagine a customer location field contains:
Port Harcourt
Port-Harcourt
Port Harcourt City
PH
P/H
If these represent the same location, the analyst needs to determine how they should be standardised.
Poor data quality can produce poor analysis.
Therefore:
Good analysis begins with good data preparation.
8. Develop Business Understanding
A strong analyst understands that data exists for a reason.
The Data Analyst Career Path in Nigeria should therefore include business knowledge.
For example, a retail analyst should understand:
Revenue
Profit
Inventory
Customer acquisition
Average order value
Sales volume
A fintech analyst might encounter:
Transactions
Customer activity
Retention
Fraud indicators
Revenue
Customer acquisition
An operations analyst might study:
Delivery times
Costs
Productivity
Capacity
Efficiency
You become more valuable when you understand both the data and the business problem behind the data.
9. Build a Data Analytics Portfolio
Portfolio development is one of the most important stages of the Data Analyst Career Path in Nigeria.
A portfolio provides evidence of practical ability.
Instead of simply writing:
“I know Excel, SQL and Power BI.”
You can show:
“I used Excel to clean and analyse 5,000 sales records and built a Power BI dashboard identifying revenue trends and underperforming product categories.”
That is stronger evidence.
A beginner portfolio could contain three to five well-documented projects.
Each project should include:
Business problem
Dataset
Tools used
Data-cleaning process
Analysis
Visualisations
Findings
Recommendations
Lessons learned
Quality is more important than the number of projects.
Data Analyst Career Path in Nigeria: Portfolio Project Ideas
Here are practical project ideas Nigerian learners can use.
1. Nigerian Retail Sales Dashboard
Analyse fictional supermarket transactions.
Study:
Sales
Products
Locations
Customers
Monthly performance
Tools:
Excel + Power BI
2. Customer Analysis
Create a fictional customer dataset and investigate:
Customer frequency
Customer value
Repeat purchases
Customer segments
Tools:
SQL + Power BI
3. Logistics Performance
Analyse fictional delivery records.
Questions could include:
Which routes experience delays?
Which locations receive the most deliveries?
What is the average delivery time?
Which months experience higher demand?
Tools:
Excel + SQL + Power BI
4. Nigerian Business Expense Analysis
Analyse fictional business expenses.
Identify:
Highest expense categories
Monthly spending
Cost trends
Potential areas for efficiency
Tools:
Excel + Power BI
5. Student Performance Dashboard
Use fictional student information to analyse:
Attendance
Scores
Subjects
Performance trends
This can be particularly useful for learners because it connects data analysis with an environment they understand.
10. Develop Communication Skills
Technical knowledge is only part of the Data Analyst Career Path in Nigeria.
You also need to communicate findings.
Imagine that you discover that sales have fallen.
Simply saying:
“Sales declined by 15%.”
is not enough.
A stronger analyst asks:
When did the decline begin?
Which products were affected?
Which locations were affected?
Did customer numbers change?
Did prices change?
Was there a seasonal factor?
What action should management consider?
The ability to explain this clearly is known as data storytelling.
11. Learn How to Use AI in Data Analytics
AI is becoming increasingly relevant to the modern Data Analyst Career Path in Nigeria.
AI tools can assist with tasks such as:
Drafting SQL
Explaining formulas
Generating Python code
Summarising data
Suggesting analysis ideas
Automating repetitive work
Helping document analytical processes
However, analysts should not blindly trust AI-generated results.
You need enough technical knowledge to verify:
SQL queries
Calculations
Data transformations
Statistical interpretations
Business conclusions
The future data analyst will increasingly need both traditional analytical skills and AI literacy.
12. Prepare for Your First Data Analyst Job
After developing skills and projects, you can begin preparing for employment.
Potential entry-level roles include:
Junior Data Analyst
Data Analyst
Reporting Analyst
Business Intelligence Analyst
Operations Analyst
Marketing Analyst
Product Analyst
Business Analyst
The exact job title and requirements vary between organisations.
Recent Nigerian career resources commonly identify banking, fintech, telecommunications, e-commerce, logistics and other sectors as areas where data analysis skills can be relevant.
Data Analyst Career Path in Nigeria by Career Level
The career progression can be broadly understood as follows.
Beginner
At this stage, you are learning:
Excel
Basic statistics
Data cleaning
Basic SQL
Basic visualisation
Your priority is developing competence.
Junior Data Analyst
A junior analyst may work on:
Reports
Data cleaning
SQL queries
Dashboards
Recurring analysis
Basic business questions
Your priority is becoming reliable.
Mid-Level Data Analyst
At this level, you may:
Own analytical projects
Build more complex dashboards
Work directly with stakeholders
Analyse business performance
Automate repetitive tasks
Provide recommendations
Your priority is developing business impact.
Senior Data Analyst
A senior analyst may:
Lead analytical projects
Mentor junior analysts
Influence business decisions
Develop analytical strategies
Work with complex datasets
Communicate with senior stakeholders
Your priority becomes influence and strategic thinking.
Analytics Lead or Manager
At the leadership level, responsibilities can include:
Managing analytics teams
Setting analytical priorities
Developing reporting strategies
Working with executives
Improving data culture
Supporting organisation-wide decision-making
The exact career progression differs between organisations, so learners should view these levels as a framework rather than a guaranteed timetable.
Data Analyst Career Path in Nigeria: Alternative Career Directions
One advantage of developing data analysis skills is that the skills can lead to several related careers.
You could eventually explore:
Business Intelligence
Focuses heavily on reporting, dashboards and organisational decision-making.
Product Analytics
Focuses on how customers use digital products.
Marketing Analytics
Focuses on campaigns, customers and marketing performance.
Financial Analytics
Focuses on financial performance, costs, revenue and business planning.
Moves further into statistics, predictive modelling and machine learning.
Data Engineering
Focuses more heavily on building the systems and infrastructure used to collect and process data.
The Data Analyst Career Path in Nigeria can therefore become a foundation for several technology and business careers.
Data Analyst Career Path in Nigeria for Students
Students can begin building relevant skills before graduation.
A student might start with:
Year 1: Computer and Excel fundamentals
Year 2: Statistics and SQL
Year 3: Power BI and practical projects
Year 4: Python, portfolio and internship preparation
This is only an example.
The important principle is to avoid waiting until graduation before acquiring practical skills.
A student who graduates with a degree plus several well-documented analytics projects may have more evidence of practical ability than someone who only has academic coursework.
Data Analyst Career Path in Nigeria for Career Changers
You do not necessarily need to begin your career in technology to move toward analytics.
For example:
Accountant → Data Analyst
Existing knowledge of financial records can be useful.
Marketer → Marketing Analyst
Existing knowledge of campaigns and customers can complement analytics skills.
Business Administrator → Business Analyst
Existing business-process knowledge can support analytical work.
Teacher → Education Data Analyst
Experience in education can provide valuable domain knowledge.
Engineer → Data Analyst
Quantitative and problem-solving skills can provide a useful foundation.
The key is to combine your existing knowledge with data skills.
Data Analyst Career Path in Nigeria for Learners in Port Harcourt
Port Harcourt provides a useful environment for learning data analytics because the city has businesses and organisations across different sectors.
A learner can create projects around scenarios involving:
Oil and gas services
Retail
Logistics
Education
Healthcare
Hospitality
Small businesses
Financial services
For example, an aspiring analyst could create a fictional oil-and-gas services dashboard showing equipment maintenance records.
Another learner could analyse a fictional Port Harcourt retail dataset.
The purpose is not to pretend that these projects are real company projects.
The purpose is to demonstrate that you understand how analytical methods can be applied to realistic business situations.
Potenmunia Tech School in Port Harcourt approaches technology training with an emphasis on practical, hands-on learning.
For learners following the Data Analyst Career Path in Nigeria, this type of approach is important because analytics is a skill that becomes stronger through practice.
Rather than learning tools only as isolated topics, learners can benefit from connecting:
For example, instead of simply learning how PivotTables work, a learner could use them to investigate a realistic sales problem.
Instead of only learning SQL syntax, the learner could use SQL to answer business questions.
Instead of only learning Power BI buttons, the learner could build a dashboard around a specific analytical problem.
Potenmunia’s approach also places emphasis on:
Hands-on practical learning
Real-world projects
Capstone experience
Portfolio development
Mentorship
Career preparation
AI integration
Future-focused skills
Innovation and entrepreneurship
This approach is particularly useful for learners who want to move from knowing about data analytics to demonstrating what they can actually do.
Common Mistakes on the Data Analyst Career Path in Nigeria
1. Learning Too Many Tools
You do not need to master ten tools immediately.
Build depth gradually.
2. Ignoring Excel
Some beginners believe that professional analysts should immediately jump to Python.
Excel remains useful for many everyday analytical tasks.
3. Avoiding SQL
If you want to work with database-driven organisations, SQL is an important skill to develop.
4. Building Only Attractive Dashboards
A dashboard should answer a question.
A beautiful dashboard with no useful insight is still a weak analytical project.
5. Copying Tutorials Without Understanding Them
Following a YouTube tutorial can help you learn.
But after completing it, try rebuilding the project independently.
Change the dataset.
Change the questions.
Explain your findings in your own words.
6. Ignoring Communication
You may find an important pattern but still struggle professionally if you cannot explain it.
7. Depending Completely on AI
AI can accelerate your work, but you remain responsible for checking the accuracy of your analysis.
How Long Does the Data Analyst Career Path in Nigeria Take?
There is no fixed period.
A learner studying consistently might structure their development like this:
Months 1–2
Data fundamentals
Excel
Basic statistics
Months 3–4
SQL
Data cleaning
More advanced Excel
Months 5–6
Power BI
Data modelling
Dashboard development
Months 7–8
Python
Pandas
Portfolio projects
Months 9+
Advanced projects
Interview preparation
Applications
Specialisation
These are learning milestones rather than guarantees.
Your actual progress depends on your background, study time, practice, learning environment and ability to apply what you learn.
Data Analyst Career Path in Nigeria: A Practical Checklist
Use this checklist to monitor your progress.
Foundation
Understand basic data concepts
Learn percentages and averages
Understand basic statistics
Develop computer skills
Excel
Learn formulas
Learn lookup functions
Learn PivotTables
Learn charts
Practise data cleaning
Build a simple dashboard
SQL
SELECT
WHERE
GROUP BY
ORDER BY
JOIN
CASE
Subqueries
CTEs
Window functions
Power BI
Import data
Clean data
Create relationships
Build data models
Learn basic DAX
Create dashboards
Practise data storytelling
Python
Learn Python fundamentals
Learn Pandas
Learn NumPy basics
Explore data visualisation
Practise automation
Portfolio
Build a sales project
Build a customer project
Build a business dashboard
Document your findings
Explain recommendations
Career
Create a professional CV
Prepare a portfolio
Practise SQL interview questions
Practise explaining projects
Develop communication skills
Look for internships and entry-level opportunities
Frequently Asked Questions About the Data Analyst Career Path in Nigeria
Can I become a data analyst without a computer science degree?
Yes.
People enter data analytics from backgrounds including economics, accounting, mathematics, engineering, business, statistics and other disciplines.
What matters is developing the required analytical and technical competencies.
What should I learn first?
For many beginners, Excel and basic data concepts are a practical starting point.
You can then progress to SQL, Power BI and Python.
Is SQL important for the Data Analyst Career Path in Nigeria?
Yes.
SQL is particularly useful when working with data stored in relational databases.
Is Python compulsory?
Not necessarily for every entry-level role.
However, learning Python can expand your analytical capabilities, especially for automation and more advanced data work.
Is Power BI worth learning?
Power BI is a useful business-intelligence and visualisation platform and can be valuable for analysts who need to create interactive reports and dashboards.
Do I need advanced mathematics?
No.
You should understand basic quantitative concepts and gradually learn statistics that are relevant to your work.
How many portfolio projects should I build?
There is no magic number.
Three to five strong, well-documented projects can provide a useful starting portfolio.
Can I learn data analytics in Port Harcourt?
Yes.
You can combine self-study, online resources, academic education and structured practical training.
For learners who prefer face-to-face guidance and project-based learning, a technology school such as Potenmunia Tech School can provide a structured environment for developing practical skills.
Can data analytics lead to other careers?
Yes.
Data analytics can provide foundations for areas such as business intelligence, product analytics, financial analytics, marketing analytics, data science and analytics management.
Conclusion on the Data Analyst Career Path in Nigeria
The Data Analyst Career Path in Nigeria is best understood as a continuous learning journey rather than a single course.
You can start with basic data literacy and Excel.
Then progress to:
Excel → Statistics → SQL → Power BI → Python → Projects → Portfolio → Professional Experience → Specialisation
The order can change depending on your background, but the principle remains the same: develop skills progressively and apply them to realistic problems.
Do not focus only on collecting certificates.
Build evidence.
Do not focus only on learning software.
Learn how to solve problems.
Do not focus only on creating attractive dashboards.
Learn how to communicate insights.
And do not treat AI as a replacement for analytical thinking. Learn how to use AI responsibly while maintaining the ability to verify your results.
For learners in Port Harcourt, Potenmunia Tech School provides a practical environment for developing technology skills through hands-on learning, real-world projects, portfolio development, mentorship and career preparation.
If you are beginning the Data Analyst Career Path in Nigeria, you do not need to master everything at once.
Start with one skill.
Practise it.
Build a project.
Learn from it.
Then move to the next stage.
That is how a beginner gradually develops into a professional data analyst.
If you are searching for Python for Data Science, the most important thing to understand is that learning data science is not simply about learning Python syntax.
Python is the programming foundation, but effective data science combines programming, statistics, data analysis, visualization, problem-solving and communication.
For a beginner, the journey can look complicated. You may encounter terms such as NumPy, pandas, Matplotlib, Seaborn, Jupyter Notebook, SQL, machine learning, artificial intelligence and data visualization almost immediately.
You do not need to master everything at once.
A better approach is to follow a structured roadmap:
Python for Data Science means using Python and its supporting libraries and tools to work with data.
This can involve:
collecting data
importing datasets
cleaning data
transforming information
exploring patterns
performing statistical analysis
creating visualizations
building predictive models
automating repetitive tasks
communicating insights
Data science itself is an interdisciplinary field concerned with extracting knowledge and useful insights from data.
Python is not a “data science language” in the narrow sense. It is a general-purpose programming language that has developed a particularly strong ecosystem for scientific computing, data analysis, visualization, artificial intelligence and machine learning.
That ecosystem is what makes Python for Data Science so useful.
One reason Python is popular for data science is that a learner can use different libraries for different parts of the workflow.
For example:
Data Science Task
Common Python Tool
Numerical computing
NumPy
Data manipulation
pandas
Visualization
Matplotlib
Statistical visualization
Seaborn
Machine learning
scikit-learn
Interactive analysis
Jupyter
Deep learning
PyTorch / TensorFlow
This ecosystem allows someone to move from basic programming to increasingly sophisticated data projects without constantly changing programming languages.
Open educational resources also commonly introduce Python data science through tools such as NumPy, pandas, Matplotlib and Jupyter.
Python for Data Science Roadmap for Beginners
If you are starting from zero, use the following roadmap.
Learning SQL alongside Python can make your data-analysis workflow much more practical.
10. Learn Jupyter Notebook
Jupyter Notebook and JupyterLab are commonly used environments for interactive data work.
They allow you to combine:
Python code
explanations
calculations
charts
analysis
This makes them useful for experimenting with datasets and documenting your reasoning.
A beginner can structure a notebook like this:
Project: Port Harcourt Sales Analysis

1. Business Question
2. Dataset Description
3. Data Cleaning
4. Exploratory Analysis
5. Visualizations
6. Findings
7. Recommendations
8. Limitations
This is much more useful than submitting a folder containing unexplained code.
11. Build Real Python Data Science Projects
One of the biggest mistakes beginners make is waiting until they have completed every tutorial before building projects.
Start early.
Your first projects do not need to be complicated.
1. Sales Analysis
Analyze a fictional or appropriately licensed sales dataset.
Questions could include:
What are the best-selling products?
What months have the highest revenue?
Which locations generate the most sales?
What is the average order value?
2. Student Performance Analysis
Analyze educational data to explore relationships between:
attendance
study time
assessment results
course performance
3. Personal Expense Analysis
Use a dataset of fictional or appropriately anonymized expenses.
Analyze:
spending categories
monthly trends
average expenses
changes over time
4. Nigerian Business Dataset
Use an appropriate public dataset to investigate a question relevant to businesses or consumers in Nigeria.
The project could examine:
customer behavior
sales
pricing
regional patterns
market trends
The goal is to demonstrate your ability to take data → analysis → insight.
12. Move From Data Analysis to Machine Learning
Once your foundations are strong, you can begin exploring machine learning.
Machine learning allows computers to learn patterns from data and use those patterns for tasks such as classification, prediction or clustering.
A beginner should understand:
features
target variables
training data
testing data
supervised learning
unsupervised learning
regression
classification
clustering
model evaluation
overfitting
One popular Python library for machine learning is scikit-learn, which provides tools for classification, regression, clustering, preprocessing and model evaluation.
Do not rush into machine learning simply because it sounds more advanced.
A strong machine-learning project still depends on good data preparation and sound analytical thinking.
13. Explore Artificial Intelligence With Python
Python also plays an important role in many AI workflows.
As you progress, you may encounter technologies such as:
natural language processing
computer vision
deep learning
generative AI
recommendation systems
predictive systems
Libraries and frameworks in the wider Python ecosystem include PyTorch, TensorFlow, Keras and other specialized tools.
For a beginner, however, the priority should remain the fundamentals.
Do not let AI distract you from learning Python properly.
Understanding variables, functions, data structures, data manipulation and analytical reasoning remains valuable even as AI-assisted programming becomes more common.
14. Use AI Responsibly While Learning Python for Data Science
AI tools can make learning more interactive.
For example, you can ask an AI assistant to:
explain an error
explain a Python function
create practice exercises
review your approach
suggest ways to improve code
explain a statistical concept
help brainstorm project questions
But avoid turning AI into a replacement for learning.
If an AI generates:
df.groupby("Product")["Revenue"].sum()
you should understand:
what df represents
what groupby() does
what "Product" means
why "Revenue" is selected
what sum() calculates
what the resulting output means
The objective is AI-assisted learning, not AI-dependent learning.
15. Build a Python for Data Science Portfolio
A portfolio can demonstrate what you can actually do.
Instead of listing:
“I know Python.”
You can demonstrate:
“I used Python and pandas to clean a sales dataset, analyze monthly revenue, create visualizations and communicate five business findings.”
That is much stronger evidence of practical ability.
Your portfolio might include:
Project Name
Retail Sales Analysis With Python
Problem
Understand sales performance across products and locations.
Tools
Python
pandas
NumPy
Matplotlib
Jupyter
Process
cleaned the dataset
handled missing values
analyzed product performance
calculated monthly revenue
created charts
Findings
Summarize the most important insights.
Limitations
Explain what the dataset cannot tell you.
This demonstrates both technical and analytical thinking.
Python for Data Science Career Paths
Learning Python for Data Science can support several different career directions.
Depending on your interests and additional skills, you could explore areas such as:
Data Analyst
Business Analyst
Data Scientist
Machine Learning Engineer
Research Analyst
Data Engineer
Python Developer
AI-focused technology roles
These roles have different requirements.
For example, a data analyst may spend significant time working with SQL, spreadsheets, Python, dashboards and business questions.
A machine-learning-focused role may require substantially deeper mathematics, programming and model-development knowledge.
You do not have to choose your final specialization on your first day of learning Python.
Python for Data Science in Port Harcourt and Nigeria
Learning data skills in Nigeria can be especially meaningful when projects connect technical concepts with practical problems.
Port Harcourt, for example, has businesses and organizations operating across areas such as:
energy
logistics
retail
education
finance
hospitality
professional services
entrepreneurship
Data can support decision-making across many of these areas.
Consider a hypothetical Port Harcourt retail company.
The company has thousands of sales records but relies on manually reviewing spreadsheets.
A Python data analyst could potentially build a workflow that:
imports the sales records
cleans the data
analyzes product performance
examines monthly trends
identifies unusual patterns
creates visualizations
communicates recommendations
That is a much more useful understanding of Python for Data Science than simply knowing how to write a for loop.
What Should You Learn First: Python, Data Analytics or Data Science?
This is a common question.
If you are completely new, a practical progression is:
How Potenmunia Tech School Approaches Python for Data Science
At Potenmunia Tech School in Port Harcourt, Nigeria, the focus is on making technology learning practical and connected to real-world application.
For a subject such as Python for Data Science, that approach is particularly relevant because learners need opportunities to move beyond theory.
Rather than simply learning Python commands, students can work toward applying programming concepts to practical projects and problems.
The learning approach emphasizes 100% practical, hands-on learning, allowing students to spend time actually working with technology rather than relying exclusively on lectures.
Real-world projects and capstone experiences can provide a structured opportunity to bring multiple skills together.
Portfolio building is another important part of the process. A learner should eventually be able to show projects that demonstrate their ability to work with data, solve problems and communicate results.
Mentorship can also help learners understand where they are making mistakes and how to improve their approach.
Beyond technical skills, career preparation matters. Learners need to understand how to present their projects, communicate their capabilities and prepare for professional opportunities.
Potenmunia’s broader focus also includes AI integration, future skills, innovation and entrepreneurship, helping learners think beyond simply completing a course and toward how technology can be applied to real problems and opportunities.
The objective is not simply to know Python.
It is to develop the ability to use Python effectively.
Useful Resources for Learning More
Learners can use reputable educational and reference resources to deepen their understanding.
For general background and reference material, Wikipedia provides articles covering topics such as Python, data science, machine learning and related technologies.
For deeper technical learning, learners should also consult official documentation and established educational resources rather than relying on a single website.
A useful principle is:
Use introductory resources to understand concepts, documentation to understand tools, and projects to develop practical competence.
CONCLUSION
Learning Python for Data Science is a journey rather than a single skill.
Start with Python fundamentals.
Then learn NumPy and pandas. Practice cleaning datasets. Learn visualization and statistics. Add SQL. Build real projects. Once your foundations are strong, explore machine learning and AI.
Most importantly, keep asking:
What problem am I trying to solve with this data?
That question changes how you learn.
Instead of memorizing Python commands, you begin thinking like a problem solver.
For someone in Port Harcourt or elsewhere in Nigeria, this can mean building projects around business, education, finance, logistics, energy, entrepreneurship or other areas relevant to the local environment.
You do not need to become an expert overnight.
Start with a small dataset.
Write some Python.
Clean the data.
Ask a question.
Find an answer.
Create a visualization.
Explain what you discovered.
Then do it again with a harder problem.
That is how Python for Data Science gradually becomes a practical and professional skill.
If you are looking for structured technology training in Port Harcourt, Potenmunia Tech School can be explored as one option for learners who want a practical environment combining hands-on learning, projects, mentorship, portfolio development and career preparation.
Frequently Asked Questions About Python for Data Science
Is Python good for Data Science?
Yes. Python has a broad ecosystem of tools for numerical computing, data analysis, visualization, machine learning and AI. Its ecosystem includes tools such as NumPy, pandas, Matplotlib and scikit-learn.
Can a complete beginner learn Python for Data Science?
Yes. Beginners can start with Python fundamentals before progressing into data-analysis libraries.
You do not need to understand machine learning before learning your first Python program.
Is Python for Data Science difficult?
It can be challenging because it combines programming, statistics, data analysis and problem-solving. However, learning progressively and practicing regularly makes the journey more manageable.
What Python libraries should I learn for Data Science?
Start with NumPy and pandas, then learn visualization with Matplotlib and Seaborn. Later, explore scikit-learn for machine learning.
You do not need to learn every library available.
Should I learn pandas or NumPy first?
A beginner can learn basic NumPy concepts before moving deeply into pandas. pandas is particularly important for working with tabular datasets.
Do I need mathematics to learn Python for Data Science?
You can begin without advanced mathematics. Basic mathematics is sufficient for getting started, while statistics and more advanced mathematics can be learned progressively.
Should I learn SQL if I already know Python?
Yes. Python and SQL solve different problems and are often complementary skills in data-related workflows.
Can I learn Python for Data Science online?
Yes. There are many online resources, documentation sites, courses and interactive learning environments available. The key is to combine learning material with consistent practical work.
What projects should a beginner build?
Start with manageable projects such as:
sales analysis
customer analysis
expense analysis
student-performance analysis
survey analysis
simple forecasting
exploratory data analysis
Choose a project with a clear question rather than simply downloading a dataset and creating random charts.
Can Python for Data Science lead to a career?
Python can contribute to careers in areas such as data analysis, data science, machine learning, software development and AI. However, career readiness requires more than Python alone. SQL, statistics, communication, problem-solving, project experience and other relevant skills may also be important.
Where can I learn Python for Data Science in Port Harcourt?
Learners in Port Harcourt, Nigria and across the globe can consider technology-training institutions such as Potenmunia Tech School, particularly if they prefer a practical approach involving hands-on learning, projects, mentorship and portfolio development.
If you are searching for a Data Science Course in Port Harcourt, you are probably interested in learning how data can be used to solve problems, make predictions, understand business performance and support better decisions.
A Data Science Course in Port Harcourt can provide a structured path for students, graduates, professionals and technology enthusiasts who want to develop practical skills in programming, statistics, data analysis, machine learning and artificial intelligence.
Data science is a multidisciplinary field that combines areas such as statistics, computing, algorithms, data analysis and scientific methods to extract knowledge and insights from data.
However, learning data science is not simply about learning Python or memorising machine learning algorithms. A useful Data Science Course in Port Harcourt should help learners understand how to approach real problems, work with datasets, communicate findings and build projects that demonstrate practical competence.
For learners in Port Harcourt and other parts of Nigeria, this makes choosing the right learning approach especially important.
A Data Science Course in Port Harcourt is a structured programme designed to teach learners how to work with data using statistical, computational and analytical techniques.
Depending on the programme, a Data Science Course in Port Harcourt may cover:
The depth of each topic depends on whether the course is designed for beginners, intermediate learners or experienced professionals.
For beginners, the most important thing is to have a logical progression from basic concepts to practical applications.
Why Consider a Data Science Course in Port Harcourt?
Port Harcourt is an important commercial and professional centre in Nigeria. Businesses and organisations in the city operate across sectors such as energy, finance, healthcare, education, logistics, retail, hospitality and professional services.
These organisations generate data through everyday activities.
For example, a Port Harcourt business could collect data about:
Customer purchases
Product inventory
Employee performance
Marketing campaigns
Expenses
Website traffic
Customer enquiries
Sales
Operational activities
A person who learns data science can develop the skills needed to examine this information and identify useful patterns.
This is one reason a Data Science Course in Port Harcourt can be relevant to people who want to connect technology skills with real business and organisational problems.
What Will You Learn in a Data Science Course in Port Harcourt?
The curriculum should depend on the level of the learner, but several core areas are particularly important.
1. Data Science Fundamentals
Before learning advanced techniques, students need to understand what data science is and how data moves through a typical workflow.
A basic workflow might look like:
Problem → Data Collection → Data Cleaning → Exploration → Analysis → Modelling → Evaluation → Communication
Understanding this process helps learners see how individual tools fit together.
2. Statistics
Statistics is an important part of data science.
A Data Science Course in Port Harcourt may introduce concepts such as:
Mean
Median
Mode
Variance
Standard deviation
Probability
Correlation
Distributions
Sampling
Hypothesis testing
Regression
Statistics helps learners interpret data rather than simply manipulate numbers.
Power BI is primarily a business intelligence and data visualisation platform, but it can complement data science skills by helping learners communicate analytical findings.
Git and GitHub
These tools can help learners organise projects and demonstrate their work to others.
Data Science Course in Port Harcourt: Practical Learning Matters
One of the most important factors to consider when selecting a Data Science Course in Port Harcourt is how much practical work is included.
There is a major difference between:
Learning what a machine learning algorithm is
and
Using a dataset to build, evaluate and explain a machine learning model.
Practical learning helps bridge that gap.
A learner should have opportunities to:
Receive a problem
Find or receive relevant data
Clean the data
Explore the dataset
Analyse patterns
Build a model where appropriate
Evaluate results
Explain findings
Present recommendations
This type of practice makes the learning process more realistic.
Real-World Data Science Projects in Port Harcourt
A strong Data Science Course in Port Harcourt can use projects that reflect realistic Nigerian scenarios.
1. Retail Sales Analysis
Imagine a retail company operating in Port Harcourt.
Students could analyse:
Monthly sales
Product categories
Customer purchases
Revenue
Inventory
Seasonal patterns
The final result could be a report explaining which products perform well and where improvements may be needed.
2. Customer Churn Prediction
A telecommunications or subscription business could be interested in identifying customers who may stop using its service.
Students could explore:
Customer tenure
Usage
Service plans
Customer complaints
Payment behaviour
They could then develop a basic predictive model and evaluate its performance.
3. Demand Forecasting
A business could use historical sales data to estimate future demand.
This can introduce learners to:
Time-series data
Trends
Seasonality
Forecasting concepts
Model evaluation
4. Nigerian Business Dashboard
Learners could combine SQL, Python or spreadsheet data with a dashboarding tool to create a business performance report.
The project could display:
Revenue
Expenses
Sales
Customers
Product performance
Monthly trends
These projects make a Data Science Course in Port Harcourt more connected to practical problem-solving.
Data Science Course in Port Harcourt and Portfolio Building
A portfolio is one of the most useful outcomes of practical technology training.
Instead of telling an employer:
“I have learned Python.”
A learner can demonstrate:
“Here is a Python project where I cleaned a dataset, analysed customer behaviour and communicated the results.”
A good beginner portfolio could contain:
Python data analysis project
SQL project
Data visualisation project
Machine learning project
Business case study
Capstone project
Each project should explain:
The problem → The data → The process → The findings → The conclusion
This makes the portfolio easier for someone else to understand.
Data Science vs Data Analytics
People searching for a Data Science Course in Port Harcourt often also encounter data analytics courses.
Although the fields overlap, they are not exactly the same.
Data analytics commonly focuses on examining data to understand performance, trends and business questions.
Data science generally covers a broader collection of methods involving programming, statistics, data analysis, machine learning and predictive modelling.
For example:
Data analytics question:
“What were our highest-selling products last month?”
Data science question:
“Can historical customer and product data help us predict future purchasing behaviour?”
Both approaches are valuable, and data analytics can provide a useful foundation for people who later want to progress into data science.
Career Opportunities After Data Science Training
Completing a Data Science Course in Port Harcourt does not automatically guarantee employment. However, developing relevant technical skills can prepare learners to explore different roles within the wider data and technology ecosystem.
Possible career directions include:
Data Analyst
Data analysts examine data and communicate insights that support organisational decisions.
Junior Data Scientist
Junior data scientists may assist with data preparation, analysis, experimentation and modelling.
Machine Learning Engineer
Machine learning engineers focus on developing and deploying machine learning systems.
Business Intelligence Analyst
BI analysts work with business data, reporting systems and dashboards.
Data Engineer
Data engineers help build systems and infrastructure for collecting, transforming and providing access to data.
Research and Quantitative Roles
Learners with strong mathematical and statistical foundations may also explore research-oriented data roles.
Data science can be applied across many Nigerian industries.
Examples include:
Banking
Fintech
Telecommunications
Healthcare
Energy
Insurance
Logistics
Retail
Education
E-commerce
Technology companies
Professional services
For learners in Port Harcourt, this creates opportunities to think beyond a single industry.
A person could develop data skills and later apply them to business, finance, technology, energy or another field where data is important.
How AI Fits Into Data Science
Artificial intelligence is increasingly connected with modern data workflows.
AI tools can assist with activities such as:
Code development
Data exploration
Documentation
Text analysis
Automation
Pattern identification
Predictive modelling
However, AI does not eliminate the need for fundamental knowledge.
Someone taking a Data Science Course in Port Harcourt should still understand statistics, data quality, programming logic and model evaluation.
AI should be treated as a tool that supports good technical work rather than a replacement for understanding.
How to Choose a Data Science Course in Port Harcourt
Before enrolling in a Data Science Course in Port Harcourt, ask several practical questions.
Does the Course Include Practical Exercises?
Find out how much time is spent actually working with data.
Does the Curriculum Include Python and SQL?
These are important foundations for many data-related roles.
Are Real-World Projects Included?
Projects help turn theoretical knowledge into practical experience.
Will You Build a Portfolio?
Ask whether learners complete projects that they can organise and present professionally.
Is Mentorship Available?
Beginners often need help understanding errors and difficult concepts.
Does the Programme Include Career Preparation?
Consider whether the training covers topics such as project presentation, professional communication, interview preparation and workplace expectations.
Does the Programme Address AI?
Modern data professionals should understand how AI is changing data-related workflows.
For learners considering a Data Science Course in Port Harcourt, Potenmunia Tech School approaches technology education with an emphasis on practical application and career preparation.
The learning approach focuses strongly on hands-on practice rather than relying only on classroom theory. Students can work through exercises and practical projects designed to help them understand how technology skills apply to real problems.
Real-world projects and capstone experiences are particularly important because data science requires more than knowing definitions. Learners need opportunities to work through complete problems from data preparation to analysis and communication.
Portfolio building is another important part of the approach. Students can use completed projects as evidence of their developing technical abilities.
Mentorship provides learners with guidance as they encounter challenges, while career and job-readiness support can help them understand how to present their skills and projects professionally.
Potenmunia also incorporates AI and future-focused skills, helping learners understand how emerging technologies can complement traditional data science techniques.
The school additionally encourages innovation and entrepreneurship, giving learners an opportunity to think about how technology and data can be used to create solutions, products or services.
For someone comparing options for a Data Science Course in Port Harcourt, these practical considerations can be more useful than choosing a programme based only on its title.
A Beginner’s Data Science Learning Roadmap
If you are completely new to data science, you can follow a gradual learning path.
1. Learn Computer and Data Fundamentals
Understand files, folders, spreadsheets, databases and basic data concepts.
2. Learn Excel
Practise formulas, sorting, filtering, tables, PivotTables and basic charts.
3. Learn Statistics
Build an understanding of descriptive statistics, probability and relationships between variables.
4. Learn SQL
Practise retrieving and summarising data from databases.
5. Learn Python
Start with programming fundamentals before moving into data science libraries.
6. Learn Pandas and NumPy
Practise manipulating and analysing datasets.
7. Learn Data Visualisation
Learn how to communicate findings using appropriate charts and dashboards.
8. Learn Machine Learning
Start with basic supervised and unsupervised learning concepts.
9. Build Projects
Apply your knowledge to realistic datasets and business problems.
10. Build Your Portfolio
Document your projects and organise them so that other people can understand your work.
How Long Does a Data Science Course in Port Harcourt Take?
There is no single answer because course duration varies between programmes and learners.
Someone studying full-time may progress faster than someone learning part-time.
More importantly, learners should measure progress by competence rather than simply counting weeks.
For example, ask:
Can I clean a dataset?
Can I write useful SQL queries?
Can I analyse data using Python?
Can I create meaningful visualisations?
Can I explain my findings?
Can I build and evaluate a basic model?
Can I document a project?
Being able to answer these questions provides a better indication of progress.
Is Data Science Suitable for Beginners?
Yes.
A beginner does not need to know advanced programming before starting a Data Science Course in Port Harcourt.
However, learners should expect to encounter mathematics, statistics and programming.
The learning process becomes easier when students progress gradually.
Instead of attempting to learn Python, SQL, statistics, machine learning and artificial intelligence simultaneously, beginners can build one foundation before moving to the next.
Common Mistakes to Avoid When Learning Data Science
Focusing Only on Certificates
A certificate can document completion, but practical skills and projects help demonstrate competence.
Learning Too Many Tools
It is better to understand a small number of relevant tools deeply than to know the names of dozens of technologies.
Copying Portfolio Projects
Learners should understand the projects they present rather than simply copying tutorials.
Ignoring Statistics
Statistics is an important foundation for interpreting data and understanding machine learning.
Avoiding Practice
Data science is a practical field. Regular practice is essential.
Expecting Instant Results
Becoming comfortable with data science takes time. Consistent practice is more useful than rushing through topics.
Who Should Take a Data Science Course in Port Harcourt?
A Data Science Course in Port Harcourt may be suitable for:
University students
Recent graduates
Working professionals
Data analysts
Technology enthusiasts
Business professionals
Entrepreneurs
People changing careers
Learners interested in artificial intelligence
The ideal starting point depends on your current skills and career goals.
Someone with a statistics background may progress differently from someone who is completely new to technology.
Frequently Asked Questions About Data Science Course in Port Harcourt
What is a Data Science Course in Port Harcourt?
A Data Science Course in Port Harcourt is a structured programme that teaches learners how to work with data using programming, statistics, data analysis, visualisation and machine learning techniques.
Can beginners take a Data Science Course in Port Harcourt?
Yes. Beginners can start with fundamental computer, programming, mathematics and statistics concepts before progressing into more advanced areas.
What programming language should I learn for data science?
Python is an important language to consider because it has a large ecosystem of libraries for data analysis, visualisation and machine learning.
Is SQL important for a Data Science Course in Port Harcourt?
Yes. SQL is useful for accessing and analysing information stored in relational databases.
Do I need mathematics to study data science?
You do not need to be an advanced mathematician to start, but mathematics and statistics become increasingly important as you progress into advanced data science and machine learning.
Can I learn data science without a computer science degree?
Yes. People enter data-related careers from different academic and professional backgrounds. Practical skills, projects and continued learning are important.
What should I look for in a Data Science Course in Port Harcourt?
Look for a programme with a clear curriculum, practical exercises, real-world projects, portfolio development, mentorship and appropriate career preparation.
Can a Data Science Course help me build a portfolio?
A practical programme can provide projects that become part of a portfolio. Learners should document those projects clearly and understand the work they present.
Is data science the same as data analytics?
No. They overlap, but data science generally encompasses a broader range of programming, statistics, machine learning and predictive modelling techniques.
Can data science skills be used in Nigeria?
Yes. Data-related skills can be applied across sectors including finance, telecommunications, healthcare, energy, logistics, retail, education and technology.
Learn More About Data Science
For an additional general reference, readers can explore Wikipedia’s overview of Data Science, which provides background on the field, its interdisciplinary nature and related concepts.
Choosing a Data Science Course in Port Harcourt is an important first step, but the course itself is only part of the learning journey.
The most valuable approach is to combine foundational knowledge with continuous practice.
A strong learning path should help you develop skills in:
Statistics
Python
SQL
Data cleaning
Data analysis
Data visualisation
Machine learning
Artificial intelligence
Problem-solving
Communication
Most importantly, you should have opportunities to apply these skills to realistic projects.
For learners in Port Harcourt, a practical Data Science Course in Port Harcourt can provide a structured environment for developing these capabilities while building a portfolio and preparing for future opportunities.
Potenmunia Tech School provides a practical, career-focused technology learning environment in Port Harcourt, with an emphasis on hands-on training, projects, portfolio development, mentorship, AI integration and career preparation.
If you are considering learning data science, take time to compare the curriculum, practical experience, project opportunities and support available before choosing a programme. The right course should help you move beyond simply learning about data science toward actually using data science skills to solve problems.
If you are looking for Data Science Training in Port Harcourt, you are probably trying to understand what data science involves, what you will learn, which tools you need, how much programming is required, and whether data science is a worthwhile skill to develop in Nigeria.
Data Science Training in Port Harcourt is becoming increasingly relevant to students, graduates, working professionals, entrepreneurs, and technology enthusiasts who want to understand how data can be used to solve real-world problems.
Data science combines areas such as statistics, programming, data analysis, data visualisation, machine learning and domain knowledge. Wikipedia describes data science as an interdisciplinary field concerned with extracting knowledge and insights from data. You can learn more about the subject through Wikipedia’s Data Science overview.
However, learning data science is not simply about learning Python or memorising machine-learning algorithms. Effective Data Science Training in Port Harcourt should help you understand the complete process of working with data—from collecting and cleaning information to analysing it, building models, communicating findings and applying results to practical problems.
This guide explains what you should know before choosing Data Science Training in Port Harcourt, what skills you can expect to develop and how to approach your learning journey.
Data science is the practice of using scientific methods, statistics, programming, algorithms and analytical techniques to extract useful knowledge and insights from data.
In simple terms, data science helps people and organisations answer questions using data.
For example, imagine a retail business in Port Harcourt has five years of sales records.
The business may want to know:
Which products sell most frequently?
Which months produce the highest revenue?
Which customers purchase most often?
What factors influence sales?
Can future sales be predicted?
Which products should the business keep in stock?
Are there unusual patterns in customer transactions?
A data science process can help investigate these questions.
This is why Data Science Training in Port Harcourt should focus not only on software but also on problem-solving and analytical thinking.
What Is Data Science Training in Port Harcourt?
Data Science Training in Port Harcourt refers to structured learning programmes designed to teach students and professionals how to work with data using programming, statistics, databases, visualisation and machine-learning techniques.
A comprehensive Data Science Training in Port Harcourt programme may introduce learners to:
The exact curriculum differs between training providers, so learners should examine the curriculum carefully before enrolling.
Why Is Data Science Training Important in Port Harcourt?
Port Harcourt is an important commercial centre in Nigeria, with businesses and organisations operating across different industries.
These organisations generate and use data every day.
A business may have data about:
Customers
Sales
Employees
Inventory
Payments
Marketing
Logistics
Operations
Website visitors
Social media activity
Without appropriate analysis, large amounts of information can remain underused.
This creates opportunities for people who understand how to organise, analyse and interpret data.
For someone considering Data Science Training in Port Harcourt, the local environment can also provide useful ideas for practical projects.
For example, learners could analyse a fictional dataset representing:
Port Harcourt retail transactions
Nigerian e-commerce purchases
Transportation activity
Customer service records
Energy consumption
School performance
Hospital appointment records
Small-business revenue
Nigerian financial transactions
The objective is not simply to create charts. It is to learn how to investigate a problem and use evidence to reach reasonable conclusions.
Who Should Enrol for Data Science Training in Port Harcourt?
One of the misconceptions about data science is that it is only suitable for computer scientists.
That is not necessarily true.
Students
Students studying computer science, mathematics, statistics, engineering, economics, business or related subjects may find data science useful.
A student can combine an existing academic background with practical technology skills.
Graduates
Graduates who want to enter technology or analytical roles can use data science training to develop practical capabilities.
For example, an economics graduate could learn Python, statistics and data analysis and apply those skills to economic datasets.
Working Professionals
Professionals who already work with reports, spreadsheets or business information can expand their analytical capabilities through data science.
Business Owners
Entrepreneurs can learn how data can support decisions involving customers, sales, marketing and business performance.
Career Switchers
People from non-technical backgrounds can also begin learning data science, although they may need additional time to develop programming and statistical foundations.
What Do You Learn in Data Science Training in Port Harcourt?
A strong Data Science Training in Port Harcourt programme should gradually introduce learners to several interconnected areas.
Python is an important programming language in modern data science.
During Data Science Training in Port Harcourt, beginners may learn:
Variables
Data types
Operators
Conditional statements
Loops
Functions
Lists
Dictionaries
File handling
Basic error handling
Working with data
The objective should be practical application.
Instead of learning Python syntax without context, students can use Python to solve data-related problems.
3. NumPy
NumPy is commonly used for numerical computing in Python.
Learners can use NumPy for:
Arrays
Numerical calculations
Mathematical operations
Data manipulation
Scientific computing
It can become particularly useful when working with larger numerical datasets.
4. Pandas
Pandas is one of the most useful Python libraries for practical data analysis.
During Data Science Training in Port Harcourt, learners can use Pandas to:
Import datasets
Examine data
Select columns
Filter records
Handle missing values
Remove duplicates
Group information
Merge datasets
Create calculated columns
Summarise data
For example, a learner could receive a dataset containing 20,000 fictional Nigerian retail transactions and use Pandas to determine which product categories generate the most revenue.
Statistics is an important component of Data Science Training in Port Harcourt.
Students may study:
Mean
Median
Mode
Range
Variance
Standard deviation
Probability
Correlation
Distributions
Sampling
Hypothesis testing
Statistics helps learners understand what data is actually saying.
For example, if a dataset shows that two variables increase together, correlation analysis can help investigate their relationship. However, correlation alone does not automatically prove that one variable causes the other.
7. Data Cleaning
Real-world data is often messy.
A dataset may contain:
Missing values
Duplicate records
Incorrect spellings
Inconsistent dates
Invalid entries
Incorrect data types
Extreme values
Data cleaning is therefore an essential part of Data Science Training in Port Harcourt.
Students should learn how to identify problems and decide how they should be handled.
Data visualisation transforms information into charts and graphical representations.
Common visualisations include:
Bar charts
Line charts
Histograms
Scatter plots
Box plots
Heatmaps
For example, instead of giving a business owner thousands of rows of monthly sales data, a data professional could create a visual showing sales trends over several years.
Machine learning is another major area students may encounter during Data Science Training in Port Harcourt.
Machine learning involves creating systems that learn patterns from data and use those patterns to make predictions or classifications.
Beginners may encounter:
Supervised Learning
The model learns from data where the expected outcome is known.
Examples include:
Predicting sales
Classifying customers
Estimating property prices
Unsupervised Learning
The system looks for patterns or groups without a predefined target.
Examples include:
Customer segmentation
Clustering
Pattern discovery
Regression
Regression can be used when predicting numerical values.
For example, a model could estimate future sales based on historical information.
Classification
Classification is used when assigning observations to categories.
For example, a model might classify transactions into different categories.
Model Evaluation
Students should also learn that building a model is not the end of the process.
A model needs to be evaluated to determine how well it performs on appropriate data.
This is an important part of responsible Data Science Training in Port Harcourt because learners need to understand both the strengths and limitations of predictive models.
Data Science Training in Port Harcourt: Tools Beginners Should Learn
Beginners do not need to master every available technology.
A practical learning path might include:
Tool
Purpose
Python
Programming and data science
Pandas
Data manipulation
NumPy
Numerical computing
SQL
Database querying
Jupyter Notebook
Interactive analysis
Matplotlib
Data visualisation
Seaborn
Statistical visualisation
Scikit-learn
Machine learning
Excel
Spreadsheet analysis
Power BI
Business intelligence and reporting
The important thing is understanding how the tools work together.
For example:
SQL → retrieve data → Python/Pandas → clean and analyse → visualisation → communicate findings
Data Science vs Data Analytics
People searching for Data Science Training in Port Harcourt often encounter another term: data analytics.
The two fields overlap, but they are not identical.
Data analytics generally focuses on examining data to answer questions, identify trends and support decisions.
Data science can include data analytics but may extend into programming, predictive modelling, machine learning and other advanced techniques.
Consider a supermarket.
A data analyst might investigate why sales declined last month.
A data scientist could potentially use historical data to build a model that predicts future sales.
Both roles use data, but their responsibilities and technical depth can differ.
This is why someone interested in Data Science Training in Port Harcourt may also benefit from learning data analytics first.
Why Hands-On Learning Matters
One of the most important things to consider when choosing Data Science Training in Port Harcourt is how much practical work is included.
There is a major difference between:
“I watched a tutorial about Pandas.”
and
“I used Pandas to clean and analyse a dataset and explained my findings.”
The second demonstrates application.
Hands-on training allows learners to:
Write code
Work with datasets
Make mistakes
Debug problems
Interpret results
Build projects
Explain their methodology
Improve through feedback
This is why practical projects should form a meaningful part of data science education.
Real-World Data Science Projects for Port Harcourt Learners
A learner completing Data Science Training in Port Harcourt can develop projects around realistic scenarios.
Retail Sales Project
Analyse fictional sales data from a Port Harcourt retail business.
Questions could include:
Which products sell most?
Which month generates the most revenue?
Which branch performs best?
What is the average order value?
Customer Analysis Project
Analyse customer records to understand purchasing behaviour.
Nigerian E-Commerce Project
Study a simulated online shopping dataset to investigate customer purchases, product categories and sales trends.
Transportation Project
Analyse fictional transportation data to examine passenger numbers, journey patterns and peak periods.
Education Project
Use an appropriate educational dataset to investigate relationships between attendance, study habits and academic performance.
The key is to treat every project as a problem-solving exercise rather than merely a coding assignment.
Building a Data Science Portfolio
A portfolio is one of the most useful outcomes of practical Data Science Training in Port Harcourt.
Instead of simply saying that you know Python or machine learning, your portfolio can demonstrate your ability.
Each project can contain:
Project title
Problem statement
Dataset description
Data-cleaning process
Exploratory analysis
Visualisations
Methodology
Model, if applicable
Results
Recommendations
Limitations
Lessons learned
A portfolio also gives you something concrete to discuss when applying for opportunities.
How Long Does Data Science Training in Port Harcourt Take?
There is no universal duration for Data Science Training in Port Harcourt.
The timeframe depends on:
Your previous experience
Course structure
Number of training hours
Study time outside class
Your programming background
The complexity of the curriculum
Your career objective
A beginner may first need to learn programming and data fundamentals before progressing to machine learning.
A learner who already understands Python and statistics may move more quickly through introductory topics.
The important question is not simply:
“How quickly can I finish data science training?”
A better question is:
“How much practical competence will I have when I finish?”
How to Choose Data Science Training in Port Harcourt
Before paying for a programme, evaluate the training carefully.
Check the Curriculum
Does it include:
Python?
SQL?
Statistics?
Data cleaning?
Data visualisation?
Machine learning?
Practical projects?
Ask About Practical Classes
Find out how much of the programme involves actually working with datasets and technology.
Ask About Projects
Will you complete projects that can become part of your portfolio?
Consider Mentorship
Mentorship can help learners overcome technical challenges and improve their projects.
Examine Career Support
If employment is your goal, look for programmes that provide useful career preparation.
Consider Learning Mode
Some learners prefer physical classroom training, while others prefer online or hybrid learning.
Potenmunia Tech School states that it offers physical, online and hybrid learning options from its Port Harcourt base.
Potenmunia Tech School approaches technology education with an emphasis on practical skills and career development.
Its technology programmes include data-related training alongside areas such as artificial intelligence, Python programming and Power BI.
For learners interested in Data Science Training in Port Harcourt, the practical approach is particularly relevant because data science requires more than theoretical knowledge.
The learning experience can be viewed around several important areas.
100% Practical, Hands-On Learning
The objective of practical training is to give learners opportunities to work with technology rather than simply listen to explanations.
In data-related learning, this can mean working with datasets, writing code, cleaning information, creating visualisations and interpreting results.
Real-World Projects
Projects give learners an opportunity to connect concepts with realistic problems.
Rather than learning Python, SQL or machine learning in isolation, students can apply those skills to practical scenarios.
Portfolio Development
A portfolio provides evidence of what a learner can actually do.
This is particularly useful for beginners who may not yet have extensive professional experience.
Mentorship
Learning data science can involve difficult concepts and technical challenges. Mentorship provides an opportunity for learners to receive guidance and feedback as they progress.
Career and Job Readiness
Potenmunia also emphasises career preparation, including portfolio development and other forms of career support. Its website describes programmes for students, graduates, working professionals and job seekers.
AI and Future Skills
Artificial intelligence is increasingly connected with modern data workflows.
Developing foundational skills in data analysis, Python, statistics and machine learning can therefore provide a useful foundation for understanding newer AI technologies.
Innovation and Entrepreneurship
Data skills can also be applied beyond traditional employment.
A learner could use data to identify a business problem, develop an analytical solution or create a technology-based service.
This innovation mindset is useful for people interested in entrepreneurship as well as employment.
Trying to jump directly into advanced machine learning without understanding the foundations can make the learning process unnecessarily difficult.
Common Mistakes to Avoid When Learning Data Science
Learning Too Many Tools
You do not need to learn every programming language or platform.
Start with the core tools and build from there.
Focusing Only on Certificates
Certificates can document training, but practical competence matters too.
Avoiding Statistics
Statistics is an important part of understanding data and evaluating models.
Copying Projects Without Understanding Them
A project is more valuable when you understand why each step was performed.
Not Building a Portfolio
Document your strongest projects as you learn.
Expecting Immediate Professional-Level Skills
Data science takes practice.
Consistent learning is more sustainable than trying to master everything within a very short period.
A Beginner’s Data Science Training Roadmap in Port Harcourt
If you are starting from zero, consider the following roadmap.
1 Understand Data
Learn basic data concepts and how organisations use information.
2. Learn Python
Develop fundamental programming skills.
3. Learn SQL
Understand databases and how to retrieve information.
4. Learn Statistics
Build your foundation in statistical reasoning.
5. Learn Pandas and NumPy
Start manipulating and analysing datasets.
6. Learn Data Visualisation
Learn how to communicate information through appropriate charts.
7. Learn Machine Learning
Begin with fundamental algorithms and model evaluation.
8. Complete Practical Projects
Work on realistic datasets and solve clearly defined problems.
9. Build Your Portfolio
Document your projects and explain your decisions.
10.Prepare for Career Opportunities
Develop your CV, portfolio, interview skills and professional network.
What Makes Good Data Science Training Different?
Not every Data Science Training in Port Harcourt programme will provide the same learning experience.
A strong programme should help you move through three levels:
Knowledge → Practice → Application
Knowledge means understanding concepts.
Practice means working with tools and datasets.
Application means using those skills to solve problems independently.
If a programme gives you only the first level, you may understand data science but struggle to apply it.
That is why practical exercises, real-world projects, mentorship and portfolio development are important considerations when selecting Data Science Training in Port Harcourt.
Final Thoughts on Data Science Training in Port Harcourt
Data Science Training in Port Harcourt can be a valuable learning pathway for people who want to develop practical skills in programming, statistics, data analysis, visualisation and machine learning.
The field is broad, so beginners should avoid trying to learn everything at once.
Start with the fundamentals.
Learn Python.
Understand SQL.
Study statistics.
Practise data analysis.
Learn how to visualise information.
Progress into machine learning.
Then apply what you know through practical projects.
Most importantly, build evidence of your ability through a portfolio.
For learners comparing Data Science Training in Port Harcourt, look beyond certificates and course titles. Examine the curriculum, practical training, projects, mentorship, portfolio opportunities and career preparation.
Potenmunia Tech School provides a technology-learning environment in Port Harcourt with physical, online and hybrid options, while its broader programmes emphasise practical technology skills, projects, career development and innovation.
If you are considering Data Science Training in Port Harcourt, take time to understand what you want to achieve and choose a learning path that helps you develop genuine, usable skills.
Frequently Asked Questions About Data Science Training in Port Harcourt
What is Data Science Training in Port Harcourt?
Data Science Training in Port Harcourt is structured education that teaches learners how to use programming, statistics, data analysis, visualisation and machine learning to work with data and solve practical problems.
Where can I learn data science in Port Harcourt?
Learners can investigate technology training schools and programmes in Port Harcourt and compare their curriculum, practical components, projects, mentorship and career support before choosing a programme.
Is Data Science Training in Port Harcourt suitable for beginners?
Yes. Beginners can start data science by learning foundational concepts and progressing gradually into Python, SQL, statistics, data analysis and machine learning.
What programming language should I learn for data science?
Python is an important language for data science. SQL is also valuable because it allows professionals to work with data stored in databases.
Do I need mathematics to learn data science?
You do not need to be an advanced mathematician to begin, but mathematics and statistics become increasingly important as you progress into more advanced data science and machine learning.
How long does Data Science Training in Port Harcourt take?
The duration varies according to the training provider, curriculum, learning schedule and student’s previous experience. Developing professional competence also requires continued practice after formal training.
What tools are used in Data Science Training in Port Harcourt?
Common tools include Python, Pandas, NumPy, SQL, Jupyter Notebook, Matplotlib, Seaborn and Scikit-learn. Excel and Power BI may also be useful depending on the learner’s career objectives.
Can I learn data science without a computer science degree?
Yes. Learners from mathematics, statistics, economics, engineering, finance, business and other backgrounds can develop data science skills.
What projects can I build while learning data science?
You can build projects around sales analysis, customer behaviour, forecasting, Nigerian business data, transportation, education, finance and other suitable datasets.
Is data analytics the same as data science?
No. They overlap significantly, but data science generally covers a broader range of technical areas, including programming, predictive modelling and machine learning.
Is Data Science Training in Port Harcourt useful for Nigerian jobs?
Data skills can be relevant across sectors including finance, retail, technology, logistics, healthcare, education, telecommunications and other industries. However, employment depends on your actual skills, experience, portfolio and the requirements of individual employers.
What should I look for before enrolling for Data Science Training in Port Harcourt?
Look for a clear curriculum, practical learning, real-world projects, experienced mentorship, portfolio development and appropriate career preparation.
Can data science be used for entrepreneurship?
Yes. Data can help entrepreneurs understand customers, analyse business performance, identify trends and develop data-driven products or services.
If you are searching for Data Science in Port Harcourt, you may be wondering what Data Science actually involves, what skills you need, which tools you should learn, and whether you can build a career in the field without an advanced technical background.
This guide provides a practical introduction to Data Science in Port Harcourt, especially for beginners in Port Harcourt and other parts of Nigeria.
Data Science is an interdisciplinary field that combines areas such as statistics, mathematics, computer science, programming, data analysis, visualization, and machine learning to extract useful knowledge and insights from data.
For someone beginning a Data Science Port Harcourt learning journey, the field may initially appear overwhelming because it combines several different disciplines. The good news is that you do not need to learn everything at once.
You can start with fundamental data concepts, Excel and statistics, then progress to SQL, Python, data analysis, visualization, and eventually machine learning and AI.
This article explains what Data Science means, why it matters in Port Harcourt, what beginners should learn, useful tools, project ideas, career possibilities, and how to develop practical skills.
Data Science is the process of using data, scientific methods, programming, statistics and computational techniques to discover patterns, generate insights, make predictions and solve problems.
A simple Data Science workflow can be represented as:
Data Collection → Data Cleaning → Data Analysis → Modelling → Evaluation → Insights → Decision
According to Wikipedia’s current overview, Data Science combines statistics, scientific computing, scientific methods, visualization, algorithms and systems to extract or extrapolate knowledge from structured and unstructured data.
For example, imagine a business in Port Harcourt that records thousands of transactions.
The business might want to know:
Which products sell most frequently?
Which months generate the highest revenue?
Which customers purchase most often?
Which locations generate the most sales?
Can future demand be predicted?
Which customers may stop using the service?
Data Science provides techniques that can help answer questions like these.
Why Data Science Port Harcourt Is Becoming an Important Skill
The phrase Data Science Port Harcourt represents more than simply a search for a training programme.
It also reflects a broader question:
How can people and organizations in Port Harcourt use data to solve real problems?
Port Harcourt has economic activity across industries including energy, logistics, retail, education, healthcare, finance, hospitality and professional services.
Each of these areas can generate data.
For example, a logistics company may collect:
Delivery locations
Delivery times
Vehicle information
Fuel consumption
Customer orders
Distance travelled
Failed deliveries
A Data Science approach could help the organization investigate patterns in those records.
A retailer could analyse customer purchases.
A school could examine student performance.
A hospital could study appointment patterns.
A financial organization could analyse transactions and customer behaviour.
This demonstrates why Data Science in Port Harcourt should not be viewed as a skill limited to software companies.
Who Should Learn Data Science in Port Harcourt?
Data Science can be suitable for different types of learners.
You may want to explore Data Science Port Harcourt if you are:
A university student
A recent graduate
A professional interested in technology
A business owner
A data analyst who wants to advance
A programmer interested in machine learning
A researcher
Someone changing careers
Someone interested in AI
A beginner looking for a technical skill
You do not necessarily need to begin as an expert programmer.
What matters is having the willingness to learn, practise and solve problems.
What Should You Learn for Data Science in Port Harcourt?
A beginner should avoid trying to learn Python, machine learning, artificial intelligence, SQL and advanced statistics simultaneously.
For example, a beginner studying Data Science Port Harcourt could create a fictional dataset of monthly sales from businesses in different areas of Port Harcourt.
The learner could then use Excel to identify:
Highest-selling products
Monthly sales trends
Average transaction values
Sales by location
Product categories with the strongest performance
This provides an excellent introduction to thinking analytically.
It is used to retrieve and manipulate information stored in relational databases.
SQL is an important skill for people learning Data Science Port Harcourt because organizations frequently store large amounts of information in databases.
Beginners should learn:
SELECT
WHERE
ORDER BY
GROUP BY
HAVING
JOIN
CASE
Aggregate functions
Subqueries
Common Table Expressions
Window functions
For example, imagine a company has 500,000 customer transactions stored in a database.
Instead of manually searching the records, SQL can help answer questions such as:
Which products generated the highest revenue?
Which customers purchased most frequently?
What were the monthly sales totals?
SQL therefore becomes an important bridge between databases and Data Science.
However, Data Science and Artificial Intelligence are not the same thing.
Data Science focuses on extracting useful knowledge from data.
AI focuses on building systems that can perform tasks associated with intelligent behaviour.
Machine learning is one of the major areas connecting Data Science and AI.
For example, historical customer data could be used to train a model that predicts whether a customer may be likely to purchase a particular product.
For learners interested in Data Science Port Harcourt, understanding AI alongside strong foundations in statistics, programming and data analysis can be valuable.
For someone researching Data Science Port Harcourt, the learning method is worth considering alongside the subjects being taught.
Potenmunia Tech School approaches technology education with an emphasis on practical application and career preparation.
The goal is to help learners move beyond simply knowing definitions and toward actually using technology to solve problems.
100% Practical, Hands-On Learning
Learners can spend time working directly with tools, datasets and technical workflows rather than relying entirely on theory.
Real-World Projects
Projects provide opportunities to apply concepts to realistic problems.
For example, instead of only learning data cleaning as a definition, a learner can work through a messy dataset and document how it was prepared.
Portfolio Building
Completed projects can become portfolio pieces that demonstrate practical ability.
Mentorship
Guidance can help learners understand difficult concepts, improve projects and develop better problem-solving habits.
Career and Job Readiness
The learning process can also include practical preparation such as project presentation, professional communication, CV development and interview preparation.
AI Integration
Modern Data Science increasingly interacts with AI.
Learners can explore how appropriate AI tools can support coding, research, analysis and productivity while still developing the foundational skills required to verify results and make sound decisions.
Innovation and Entrepreneurship
Data skills can also support entrepreneurship.
A learner may identify a business problem, analyse available information and develop a technology-based solution.
How to Start Data Science in Port Harcourt
If you are completely new, use a gradual approach.
1. Understand Data
Learn about datasets, variables, records and data types.
2. Learn Excel
Practise formulas, sorting, filtering, PivotTables and charts.
3. Learn Statistics
Study averages, percentages, probability, correlation and basic distributions.
4. Learn SQL
Practise querying, filtering, grouping and joining database information.
5. Learn Python
Begin with Python fundamentals.
6. Learn Pandas and NumPy
Use Python to work with datasets.
7. Learn Visualization
Create charts and dashboards that communicate insights.
8. Learn Machine Learning
Move into predictive modelling after developing strong foundations.
9. Build Projects
Create realistic projects based on problems that interest you.
10. Build a Portfolio
Document your work and explain your methodology and findings.
Common Data Science Mistakes Beginners Should Avoid
Trying to Learn Everything Immediately
Data Science is broad. Learn progressively.
Focusing Only on Certificates
Certificates can document learning, but practical ability is equally important.
Avoiding Projects
You need practice to turn concepts into skills.
Ignoring Statistics
Statistics is important for understanding data and evaluating models.
Copying Projects
A copied project does not demonstrate your ability to solve problems independently.
Ignoring Communication
A great analysis is less useful if you cannot explain its meaning.
You do not have to complete everything immediately.
Think of the checklist as a roadmap.
Frequently Asked Questions About Data Science Port Harcourt
What is Data Science Port Harcourt?
Data Science Port Harcourt refers broadly to learning, practising, applying and building careers around Data Science within Port Harcourt and its surrounding technology and business environment.
Where can I learn Data Science in Port Harcourt?
You can research technology training providers in Port Harcourt and compare their curriculum, practical projects, mentorship, portfolio opportunities and career preparation. Potenmunia Tech School is one option for learners looking for a practical technology-training environment.
Can beginners learn Data Science in Port Harcourt?
Yes. Beginners can start with computer fundamentals, Excel and statistics before progressing to SQL, Python, data analysis and machine learning.
What should I learn first for Data Science?
Start with fundamental data concepts and statistics. Excel can provide an accessible introduction before progressing to SQL and Python.
Is Python important for Data Science?
Yes. Python is widely used for data manipulation, analysis, visualization and machine learning.
Is SQL important for Data Science?
Yes. SQL is particularly useful for accessing and manipulating information stored in relational databases.
Is Data Science the same as Data Analytics?
No. They overlap, but Data Science generally has a broader scope that can include programming, statistics, machine learning and predictive modelling.
Can Data Science be useful for Nigerian businesses?
Yes. Data-driven methods can be applied across areas such as finance, retail, logistics, healthcare, education, telecommunications and energy.
Do I need advanced mathematics?
You do not need advanced mathematics to begin. However, mathematical and statistical knowledge becomes increasingly important as you progress into advanced Data Science and machine learning.
Can I learn Data Science without programming experience?
Yes. You can begin with basic computer and data skills and gradually learn programming.
What projects can I build as a Data Science beginner?
You could build sales-analysis projects, customer segmentation projects, business dashboards, delivery-analysis projects, forecasting projects and other projects based on realistic datasets.
How can I become job-ready?
Develop practical skills, complete projects, build a portfolio, learn to communicate your findings and practise solving realistic business problems.
Conclusion on Data Science Port Harcourt
Data Science Port Harcourt is not simply about learning Python or memorizing machine-learning algorithms.
It is about learning how to use data to understand problems, discover patterns, make predictions, communicate insights and support better decisions.
The most important part is not trying to learn everything immediately.
Start with the fundamentals.
Practise regularly.
Work with realistic datasets.
Build projects.
Learn how to explain your findings.
Then gradually move toward advanced Data Science and AI.
For learners exploring Data Science in Port Harcourt, Potenmunia Tech School provides a practical, career-focused technology learning environment that emphasizes hands-on experience, real-world projects, portfolio development, mentorship, career preparation, AI integration and innovation.
If you are considering Data Science as a career or professional skill, take time to compare learning paths, understand the skills involved and choose an environment where you can practise what you learn.
The goal should not simply be to say that you have studied Data Science.
The goal should be to demonstrate that you can use data to solve problems.
Every time a customer makes a purchase, someone visits a website, a company records an expense, a student completes a course, a business receives an enquiry, or an organization tracks its operations, data is created.
But raw data is not automatically useful.
A spreadsheet containing thousands of rows can contain valuable information while still being difficult for a person to understand. Data visualization helps solve this problem by transforming data into charts, graphs, dashboards, maps and other visual formats that make patterns and relationships easier to see.
At its simplest, data visualization is the visual representation of data.
At a more practical level, data visualization helps answer questions such as:
What is happening?
Why is it happening?
Where is it happening?
When did it happen?
Which category is performing better?
What has changed?
Are there unusual results?
What should the business investigate next?
This is why data visualization is an important part of modern data analytics and business intelligence.
For businesses, data visualization can turn complicated reports into understandable information. For analysts, it can make patterns and anomalies easier to investigate. For managers and entrepreneurs, it can provide a clearer basis for decision-making.
For learners developing technology skills in Port Harcourt and across Nigeria, data visualization is therefore more than a software skill. It is a way of thinking about data and communicating what the data means.
What Is Data Visualization?
Data visualization is the process of representing data visually so that people can understand, explore and communicate information more effectively.
Data visualization can use:
Bar charts
Line charts
Pie charts
Donut charts
Histograms
Scatter plots
Box plots
Heat maps
Geographic maps
Tables
KPI cards
Interactive dashboards
Area charts
Treemaps
Waterfall charts
Funnel charts
Bubble charts
Network diagrams
The appropriate visualization depends on the type of data, the question being asked and the audience.
Wikipedia’s overview of data and information visualization similarly describes visualization as the creation of graphical or visual representations that can help people explore data, identify patterns, understand relationships and gain insights.
Data visualization can therefore be useful at multiple stages.
Exploratory Data Visualization
Exploratory visualization helps the analyst investigate the dataset.
The analyst may create several charts to discover:
Patterns
Trends
Relationships
Outliers
Distribution
Missing information
At this stage, the analyst is asking:
What is happening in this data?
Explanatory Data Visualization
Explanatory visualization is used when the analyst already has a finding and wants to communicate it.
The question becomes:
How can I explain this finding clearly?
This distinction is important.
An exploratory dashboard might contain many visualizations because the analyst is investigating possibilities.
A management report might contain only a few carefully selected visualizations because the purpose is to communicate specific findings.
Data Visualization and Business Intelligence
Business intelligence, often called BI, involves using data, analytical methods and technology to support business decisions.
Data visualization is a major component of many business intelligence systems.
A business intelligence dashboard can allow managers to monitor:
Revenue
Profit
Customer acquisition
Sales performance
Inventory
Operational efficiency
Marketing performance
For example, a retail business could build a Power BI dashboard showing sales performance across different branches.
A manager could filter the dashboard by:
Month
Branch
Product
Customer segment
Instead of asking an analyst to prepare a new spreadsheet every time, the dashboard can make information easier to explore.
Data Visualization and Data Storytelling
Data storytelling combines data, visualization and narrative.
Instead of simply displaying:
Revenue decreased by 14%.
a data story might explain:
Revenue declined over three consecutive months, with the largest decrease occurring in one product category. The decline coincided with reduced sales volume in several locations.
The visualization provides evidence.
The narrative provides context.
The insight provides meaning.
This is why effective data visualization is closely connected to communication.
A good data analyst should not only know how to create charts. They should also know how to explain what the charts mean.
Data visualization has applications across many industries in Nigeria.
Retail
Retail businesses can visualize:
Sales by product
Revenue by location
Inventory
Customer purchases
Seasonal demand
A retailer in Port Harcourt, for example, could create a dashboard showing which product categories generate the most revenue during different periods.
Banking and Financial Services
Financial organizations work with large amounts of transactional and customer information.
Data visualization can help teams monitor:
Transactions
Customer activity
Financial performance
Operational metrics
Risk indicators
Logistics
A logistics company can visualize:
Delivery times
Orders by location
Fleet activity
Delivery volumes
Delayed shipments
Location-based data visualization can be particularly useful for understanding operational patterns.
Education
Educational institutions can visualize:
Enrolment
Attendance
Student performance
Course completion
Examination results
A school could use data visualization to identify subjects where student performance changes significantly between terms.
Marketing
Marketing teams can visualize:
Website traffic
Leads
Advertising spending
Conversion rates
Social media engagement
Customer acquisition
This allows marketers to compare campaigns and investigate which activities are producing useful results.
Small Businesses
Data visualization is not only for large corporations.
A small business can create a simple Excel dashboard containing:
Monthly revenue
Expenses
Profit
Number of customers
Best-selling products
Even a relatively simple data visualization can improve understanding of business performance.
Data Visualization Tools
There are many tools available for creating data visualizations.
Data visualization sits at the intersection of these skills.
Data Visualization and Artificial Intelligence
Artificial intelligence is changing how people interact with data.
AI tools can increasingly assist with tasks such as:
Exploring datasets
Generating summaries
Identifying patterns
Writing analytical code
Suggesting visualizations
Explaining charts
However, AI does not eliminate the need for human analytical judgment.
A person still needs to understand:
Whether the data is reliable
Whether the question is meaningful
Whether the visualization is appropriate
Whether the interpretation makes sense
Whether an apparent relationship is actually meaningful
Future data professionals therefore need both technology skills and critical thinking.
How Potenmunia Tech School Approaches Data Visualization
At Potenmunia Tech School in Port Harcourt, data visualization can be learned as part of a broader practical approach to technology and data skills.
The emphasis is on moving beyond simply learning where to click inside a software application.
A learner should understand:
What problem am I solving?
What data do I need?
How should I analyze it?
Which visualization communicates the result?
What does the result actually mean?
How can I present the insight to another person?
This approach connects data visualization with practical projects and real-world problem-solving.
For example, instead of simply asking learners to create a bar chart, a project could involve a fictional Nigerian business with several months of sales data.
The learner could:
Import the data.
Clean the dataset.
Analyze sales.
Identify trends.
Create visualizations.
Build a dashboard.
Explain the findings.
Recommend areas for further investigation.
Document the project as part of a portfolio.
This is where hands-on learning becomes important.
Potenmunia’s practical approach can also connect data visualization to portfolio building, giving learners opportunities to demonstrate what they can actually create rather than relying only on a list of completed courses.
Mentorship can help learners understand how technical projects relate to real workplace expectations, while career and job-readiness support can help them develop the communication and presentation skills needed to explain their work.
The same foundation can also support innovation and entrepreneurship. An entrepreneur who understands data visualization can use dashboards and analytics to monitor customers, sales, expenses, marketing performance and other business indicators.
As technology continues to evolve, AI integration and future-focused skills can further expand how learners approach data analysis and visualization.
Why Data Visualization Is a Valuable Technology Skill
Data visualization is useful because data alone does not automatically create understanding.
An organization can collect millions of records and still struggle to answer basic business questions.
The value comes from being able to move from:
Data → Information → Analysis → Visualization → Insight → Decision
That ability is useful across many roles.
A:
Data analyst
Business analyst
Business intelligence professional
Marketing analyst
Product analyst
Operations professional
Entrepreneur
Manager
may all use data visualization differently.
The tools may change, but the underlying skill remains valuable:
understanding information and communicating what it means.
Data Visualization Checklist
Before publishing a dashboard or report, ask:
Data
Is the data accurate?
Is the data complete?
Have duplicates been checked?
Are dates and categories consistent?
Analysis
What question am I answering?
Are the calculations correct?
Have I investigated unusual values?
Visualization
Is the chart appropriate?
Is the chart easy to read?
Are the labels clear?
Is unnecessary information removed?
Communication
Can someone understand the main message quickly?
Have I explained important findings?
Is there enough context?
Decision-making
What does the insight mean?
What should the organization investigate next?
What additional information might be required?
Frequently Asked Questions About Data Visualization
What is data visualization?
Data visualization is the graphical representation of data using charts, graphs, dashboards, maps and other visual formats. It helps people explore, understand and communicate patterns and relationships in data.
Why is data visualization important?
Data visualization makes complex information easier to understand. It can help people identify trends, compare categories, discover unusual results and communicate analytical findings.
What is the purpose of data visualization?
The purpose of data visualization is to make data easier to explore, interpret and communicate. In business environments, it can support data-driven decision-making.
Is data visualization part of data analytics?
Yes. Data visualization is an important part of data analytics. Analysts use visualizations to explore datasets, identify patterns and communicate findings.
What are the most common types of data visualization?
Common types include:
Bar charts
Line charts
Pie charts
Histograms
Scatter plots
Heat maps
Maps
Dashboards
Tables
KPI cards
What is a data visualization dashboard?
A data visualization dashboard is a collection of charts, metrics and other visual elements presented together to help users monitor and understand important information.
What is the best tool for data visualization?
There is no single tool that is best for every situation. Excel is useful for beginners, while Power BI and Tableau are widely used for interactive business intelligence. Python provides additional flexibility for people who want to combine programming with data analysis and visualization.
Can I learn data visualization without programming?
Yes. You can learn many data visualization fundamentals using tools such as Excel and Power BI without first becoming a programmer.
Programming can be added later as your analytical requirements become more advanced.
Is Power BI a data visualization tool?
Power BI is a business intelligence platform that includes extensive data visualization and reporting capabilities.
Can Excel be used for data visualization?
Yes. Excel supports many types of charts, PivotTables, conditional formatting and dashboard-style reporting.
Is data visualization useful for small businesses?
Yes. Small businesses can use data visualization to monitor sales, expenses, customers, inventory, marketing and other important business metrics.
What is data storytelling?
Data storytelling combines data analysis, visualization and narrative to communicate an insight clearly to an audience.
What should a beginner learn before data visualization?
A beginner can start with spreadsheet fundamentals, basic data analysis and data-cleaning concepts. From there, they can learn dashboard creation and tools such as Power BI.
How can I build a data visualization portfolio?
Create several practical projects based on realistic datasets. Explain the business question, data-cleaning process, analysis, visualizations, insights and recommendations for each project.
Is data visualization useful for a data analyst career?
Yes. Data visualization is an important skill for many data-related roles. However, aspiring data analysts should also develop data cleaning, SQL, statistics, analytical thinking and communication skills.
Conclusion
Data visualization is one of the most practical ways to transform complex information into something people can understand.
A spreadsheet may contain thousands of numbers.
A data visualization can reveal a trend.
A dashboard can bring several metrics together.
A well-designed chart can make a comparison obvious.
A data story can explain what happened.
And a carefully interpreted visualization can contribute to a better business decision.
That is why learning data visualization should not be limited to learning how to create charts.
The deeper skill is learning how to move from raw data to useful insight.
For learners in Port Harcourt and across Nigeria, developing this capability can provide a strong foundation for further study in data analytics, business intelligence, technology and related fields.
Potenmunia Tech School approaches technology education with an emphasis on practical learning, real-world projects, portfolio development, mentorship, career preparation, innovation and future-oriented skills.
If you are beginning your data journey, start with a small dataset. Ask a meaningful question. Clean the data. Analyze it. Create a visualization. Explain what you discovered.
Then do it again with a more challenging problem.
Over time, you will learn that the most valuable part of data visualization is not the chart itself.
It is the insight the chart helps you see and communicate.
If you are searching for Data Analyst Jobs in Port Harcourt, one of the most important questions to ask is not simply, “Where can I find a data analyst job?”
A better question is:
“What skills do employers expect from someone applying for Data Analyst Jobs in Port Harcourt?”
The answer goes beyond having a certificate.
Employers need people who can collect, clean, analyse and interpret information and then turn that information into useful insights for business decisions. In practical terms, a data analyst helps an organisation understand what its data is saying.
According to Wikipedia’s overview of data analysis, data analysis involves inspecting, cleaning, transforming and modelling data to discover useful information, support conclusions and improve decision-making.
This makes data analytics relevant to businesses across many industries.
For people looking for Data Analyst Jobs in Port Harcourt, developing practical skills in Microsoft Excel, SQL, Power BI, statistics, Python, data visualisation and communication can provide a strong foundation.
But technical tools are only part of the picture.
You also need to know how to solve problems, communicate findings, build a portfolio and demonstrate that you can apply your skills to realistic situations.
What Are Data Analyst Jobs in Port Harcourt?
Data Analyst Jobs in Port Harcourt are roles where professionals use data to help organisations understand performance, identify trends, solve problems and make informed decisions.
A data analyst might work with:
Sales records
Customer information
Financial data
Marketing data
Inventory records
Operational reports
Employee information
Survey results
Website and digital data
Business performance indicators
The exact responsibilities depend on the employer and industry.
For example, a retail company may need an analyst to understand product sales.
A logistics company may want to analyse delivery performance.
A financial organisation may analyse customer transactions.
An energy-related company may need reporting and operational analysis.
A healthcare organisation may need someone to work with patient or operational data.
This is one reason Data Analyst Jobs in Port Harcourt can exist across multiple industries rather than only within technology companies.
Why Data Analytics Skills Matter in Port Harcourt
Port Harcourt has a diverse business environment, including companies and organisations involved in energy, professional services, finance, retail, logistics, education, healthcare and other sectors.
All of these organisations can generate data.
The challenge is turning that data into useful information.
Consider a fictional Port Harcourt retail business with thousands of transactions.
Management may want answers to questions such as:
Which products sell the most?
Which products generate the most revenue?
Which months have the strongest sales?
Which customers buy most frequently?
Which locations perform better?
Are sales increasing or declining?
Which products may need additional marketing?
A data analyst can help answer these questions.
That is the practical value behind many Data Analyst Jobs in Port Harcourt.
What Skills Are Required for Data Analyst Jobs in Port Harcourt?
There is no universal list of requirements for every data analyst position.
However, several skills are particularly useful for anyone preparing for Data Analyst Jobs in Port Harcourt and Nigeria.
Python is not required for every entry-level data analyst position, but it can be a valuable addition to your skill set.
Python can support:
Data cleaning
Data transformation
Exploratory analysis
Automation
Statistical analysis
Repetitive tasks
Libraries such as pandas are widely used for working with structured data.
For someone beginning a career in data analytics, however, it is usually better to build a strong analytical foundation before trying to learn every advanced Python technique.
6. Data Visualisation
A data analyst must communicate information effectively.
You may have discovered an important trend, but if nobody understands your explanation, the analysis has limited value.
You should learn how to choose appropriate charts and explain:
What happened?
Why might it have happened?
Why does it matter?
What should the organisation investigate next?
Tools such as Power BI, Excel and Tableau can support this process.
7. Communication
Communication is one of the most underrated skills for people searching for Data Analyst Jobs in Port Harcourt.
A data analyst may work with people who have little or no technical background.
You might need to explain your findings to:
Managers
Business owners
Marketing teams
Finance teams
Operations staff
Project managers
Executives
The ability to translate technical analysis into clear business language can make a significant difference.
8. Business Understanding
Knowing how to use Excel or SQL is useful.
Understanding why the business needs the analysis is even more important.
Suppose an organisation asks:
“Show us our monthly sales.”
You should be able to go further.
Ask:
Which products are responsible for the change?
Which customer groups are contributing?
Which locations are performing differently?
What happened compared with the previous period?
What should management investigate?
That is where technical skills meet business thinking.
9. AI Literacy
AI is becoming increasingly relevant to data analysis.
Modern analysts can use AI tools to support activities such as:
Generating SQL drafts
Explaining formulas
Brainstorming analytical questions
Automating repetitive tasks
Documenting analysis
Exploring datasets
However, AI-generated output still needs human verification.
A data analyst should understand the underlying data well enough to identify incorrect assumptions, misleading conclusions or faulty calculations.
For future Data Analyst Jobs in Port Harcourt, AI literacy can therefore complement rather than replace fundamental analytical skills.
Where Can You Find Data Analyst Jobs in Port Harcourt?
People searching for Data Analyst Jobs in Port Harcourt should avoid limiting their search to companies that describe themselves as technology companies.
Potential industries include:
Oil and Gas
Energy-related organisations generate large amounts of operational, financial and project data.
Analytics can support reporting, performance monitoring and decision-making.
Banking and Financial Services
Financial institutions use data for reporting, customer analysis, risk management and operational decisions.
Fintech
Fintech companies can require analysts to work with transaction, customer and product data.
Retail
Retail businesses can use data to understand sales, customers, inventory and product performance.
Logistics
Logistics organisations can analyse deliveries, routes, costs, customers and operational performance.
Healthcare
Healthcare organisations can use data for operational reporting, planning and service analysis.
Education
Schools, training organisations and educational institutions can analyse enrolment, attendance, performance and other information.
Professional Services
Consulting and professional-service organisations may use analysts to support research, reporting and client projects.
This means your search for Data Analyst Jobs in Port Harcourt should consider industries as well as job titles.
Data Analyst Job Titles to Search For
Do not search only for:
“Data Analyst Jobs in Port Harcourt.”
Also look for related titles such as:
Junior Data Analyst
Data Analyst
Business Intelligence Analyst
Reporting Analyst
Operations Analyst
Business Analyst
Marketing Analyst
Financial Analyst
Data Reporting Specialist
Business Intelligence Specialist
Data and Reporting Officer
Research Analyst
Different companies can use different titles for similar responsibilities.
What Employers Look for Beyond a Certificate
One of the biggest mistakes beginners make when searching for Data Analyst Jobs in Port Harcourt is assuming that a certificate is enough.
A certificate can demonstrate that you completed training.
But employers also want evidence of practical ability.
Imagine two applicants.
Candidate A
Has several certificates but no portfolio projects.
Candidate B
Has fewer certificates but can demonstrate:
An Excel project
A SQL project
A Power BI dashboard
A documented analytical process
Business insights
Recommendations based on the findings
Candidate B has tangible evidence to discuss.
This is why portfolio development should be part of your preparation for Data Analyst Jobs in Port Harcourt.
How to Build a Data Analyst Portfolio
You do not need dozens of projects.
Three to five carefully developed projects can provide a useful foundation.
1. Sales Analysis
Analyse a fictional or publicly available sales dataset.
Look at:
Revenue
Products
Customers
Monthly trends
Sales performance
Use Excel or Power BI.
2. SQL Analysis
Create or use a database containing:
Customers
Orders
Products
Transactions
Then answer practical business questions using SQL.
3. Power BI Dashboard
Create a dashboard that answers a specific business question.
For example:
“What is driving the company’s sales performance?”
Do not simply fill the screen with charts.
Explain the insights.
4. Nigerian Business Dataset
Build a project around a Nigerian context where appropriate.
Potential themes include:
Transportation
Education
Energy
Agriculture
Population
Business activity
Consumer behaviour
Make sure the data is legally and ethically sourced and clearly document its limitations.
5. AI-Assisted Data Analysis
Demonstrate how AI can support your workflow.
For example, you could document how you used an AI tool to help generate initial SQL ideas and then explain how you manually checked and corrected the output.
This demonstrates both technical and modern workplace skills.
How to Prepare for Data Analyst Jobs in Port Harcourt
A practical learning path can help you avoid becoming overwhelmed.
1. Learn Excel
Master the fundamentals before moving into more advanced tools.
2. Learn SQL
Practise retrieving and analysing data from databases.
3. Learn Power BI
Build dashboards and learn data modelling and visualisation.
4. Learn Statistics
Understand the mathematics behind the analysis.
5. Learn Python
Add Python when your analytical foundation is strong enough.
6. Build Projects
Do not wait until you have mastered everything.
Build projects as you learn.
7. Build Your Portfolio
Document your projects professionally.
8. Prepare Your CV
Highlight relevant skills and measurable project outcomes.
9. Practise Interviews
Prepare for:
Excel questions
SQL questions
Data interpretation
Business case studies
Power BI questions
Behavioural questions
10. Start Applying
Once you can demonstrate practical competence, begin applying rather than waiting until you feel “perfect.”
For learners interested in Data Analyst Jobs in Port Harcourt, Potenmunia Tech School positions its data analytics training around practical technology skills and career preparation.
Its published programme covers Excel, SQL, SPSS, Tableau, Python and Power BI, giving learners exposure to several tools used across data analysis and business intelligence.
The school’s broader approach is designed for students, graduates, working professionals and job seekers, with practical projects and professional certification included among its programme features.
For someone preparing for Data Analyst Jobs in Port Harcourt, the useful part of this approach is the emphasis on applying skills rather than treating learning as purely theoretical.
A practical learning experience should help you:
Work with real or realistic datasets
Clean and transform data
Write SQL queries
Create dashboards
Interpret results
Build portfolio projects
Receive mentorship
Develop job-readiness skills
Understand how AI can support modern data workflows
Potenmunia also offers separate courses covering Excel, SQL, Power BI, Python and data science, allowing learners to develop specific skills alongside broader data-analysis training.
What Makes a Strong Data Analyst Candidate?
A strong candidate for Data Analyst Jobs in Port Harcourt does not necessarily know every software tool.
Instead, they can demonstrate a combination of:
Technical ability + analytical thinking + communication + business understanding + practical evidence.
For example, imagine an interviewer gives you a sales dataset.
They might not only ask:
“Can you create a PivotTable?”
They could ask:
“Sales dropped by 15% last month. What would you investigate?”
A good analyst might consider:
Product performance
Customer activity
Pricing changes
Marketing campaigns
Seasonality
Stock availability
Geographic differences
Data-quality problems
That approach demonstrates analytical thinking.
Data Analyst Jobs in Port Harcourt: Your Job-Readiness Checklist
Before applying, check whether you can confidently say yes to the following.
Technical skills
I can analyse data in Excel.
I understand PivotTables.
I can clean a dataset.
I can write basic SQL queries.
I understand SQL JOINs.
I can create a Power BI dashboard.
I understand basic statistics.
I have started learning Python or understand where it fits.
Analytical skills
I can turn a business problem into analytical questions.
I can identify trends.
I can investigate unusual results.
I understand the difference between correlation and causation.
I can explain limitations in my analysis.
Portfolio
I have at least three practical projects.
My projects use realistic datasets.
I explain the problem behind each project.
I document my process.
I explain the insights.
I provide recommendations where appropriate.
Career preparation
My CV clearly presents my analytical skills.
I can explain every project on my CV.
I have prepared for SQL interviews.
I can discuss a Power BI dashboard.
I can explain technical concepts to a non-technical person.
Frequently Asked Questions About Data Analyst Jobs in Port Harcourt
Are there Data Analyst Jobs in Port Harcourt?
Yes, data analysis skills can be relevant to organisations across Port Harcourt’s business environment. Opportunities can appear under different titles and across industries such as finance, retail, logistics, healthcare, professional services and energy.
However, vacancies change frequently, so candidates should check current job listings and study the requirements employers are actually requesting.
What skills do I need for Data Analyst Jobs in Port Harcourt?
Start with Excel, SQL, Power BI and statistics. Python can be added as your skills develop. Communication, business understanding, problem-solving and portfolio development are also important.
Can I become a data analyst without a computer science degree?
Yes. Data analytics can be learned by people from different educational backgrounds. Degrees in computer science, statistics, mathematics, economics, engineering and related areas can be useful, but practical competence remains important.
Is Excel enough for Data Analyst Jobs in Port Harcourt?
Excel is an excellent starting point, but learning SQL and a visualisation/business-intelligence platform such as Power BI can broaden your capabilities.
Do I need Python for Data Analyst Jobs in Port Harcourt?
Not every position requires Python. However, it is a useful skill for data cleaning, automation and more advanced analytical work.
Is SQL difficult to learn?
SQL can seem unfamiliar at first, but beginners can learn it progressively. Start with SELECT, WHERE, ORDER BY and GROUP BY before moving into JOINs and more advanced concepts.
Do I need a data analytics certificate?
A certificate can support your professional profile, but it should be combined with practical skills and projects. Your ability to demonstrate what you can actually do is important.
How many projects should I have in my portfolio?
There is no fixed number. Three to five strong projects can be a useful starting point if they demonstrate different skills and clearly explain the business problem, analysis and findings.
Can I work remotely as a data analyst?
Some data-analysis roles can be remote or hybrid, depending on the employer and position. Developing strong technical and communication skills can help you compete for opportunities beyond your immediate location.
What is the difference between a data analyst and a data scientist?
A data analyst generally focuses on examining data, identifying patterns, creating reports and supporting business decisions. Data science can involve more advanced statistical modelling, machine learning and predictive systems. There is some overlap between the fields.
Conclusion Data Analyst Jobs in Port Harcourt
The search for Data Analyst Jobs in Port Harcourt should begin with skills rather than job titles.
Learn the tools.
Understand the concepts.
Practise with real datasets.
Build projects.
Develop your communication skills.
Then learn how to demonstrate your abilities to employers.
You do not need to know everything before beginning. A realistic path is to start with Excel, progress to SQL and Power BI, strengthen your statistical thinking, add Python and continue building projects.
For learners who prefer structured training, Potenmunia Tech School provides a practical data-analysis programme covering Excel, SQL, SPSS, Tableau, Python and Power BI, alongside its wider focus on practical digital skills and career preparation.
The goal should not simply be:
“I completed a data analytics course.”
The stronger statement is:
“I can take a business problem, analyse the data, explain what I discovered and show you the project.”
That is the kind of practical capability worth developing when preparing for Data Analyst Jobs in Port Harcourt. wikipedia


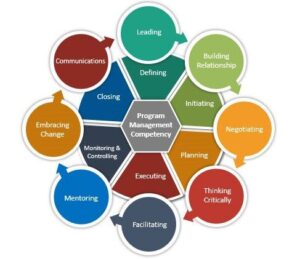

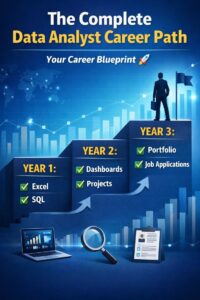

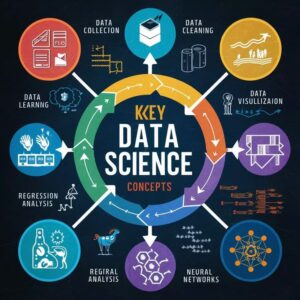
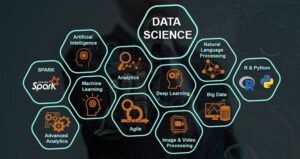

 What Are Data Analyst Jobs in Port Harcourt?