
Data has become one of the most important resources for modern businesses and organizations.
Every day, businesses generate information from sales transactions, customers, employees, expenses, inventory, marketing campaigns, operations and financial activities.
But raw data by itself does not automatically create value.
Businesses need people who can take that raw information, organize it, clean it, analyze it, and turn it into useful insights.
This is where Excel for Data Analysis becomes extremely valuable.
Microsoft Excel is one of the most accessible tools for beginners who want to develop practical data analysis skills. With the right knowledge, Excel can be used to clean datasets, perform calculations, identify trends, summarize information, create visualizations, build dashboards, and support business decisions.
But learning Excel for Data Analysis is more than learning formulas.
It is about learning how to use Excel to answer real questions.
At Potenmunia Tech School in Port Harcourt, Nigeria, our approach to Excel for Data Analysis focuses on practical learning, real-world projects, mentorship, portfolio development, career readiness and the integration of AI and future skills.
Our goal is simple:
Learn the skill. Practise the skill. Build with the skill. Showcase the skill. Prepare for the opportunity.
What Is Excel for Data Analysis?
Excel for Data Analysis is the process of using Microsoft Excel to organize, clean, transform, calculate, summarize, visualize and interpret data in order to discover useful information and support better decisions. Microsoft Excel is a widely used spreadsheet application that can support calculations, data organization, analysis and reporting. For broader background on spreadsheet software and related concepts, readers can explore Wikipedia.
In simple language:
Excel for Data Analysis means using Excel to turn raw data into meaningful information.
For example, imagine a business has 10,000 sales records.
The records may contain:
- Customer names
- Product names
- Dates
- Locations
- Quantity sold
- Unit prices
- Sales representatives
- Revenue
- Expenses
- Profit
Looking at thousands of rows manually does not provide much insight.
With Excel for Data Analysis, you can transform that information into answers.
You can determine:
- Total revenue
- Average sales
- Best-selling products
- Lowest-performing products
- Monthly sales trends
- Sales by location
- Sales by employee
- Customer purchasing patterns
- Product performance
- Profitability
- Performance against targets
That is the power of Excel Data Analysis.
Why Is Excel for Data Analysis Important?
Businesses do not simply need data.
They need understanding.
Consider a business owner who knows that the company generated ₦20 million in sales.
That number is useful, but it does not tell the complete story.
The business owner may also want to know:
- Which products generated the most revenue?
- Which customers purchased the most?
- Which month performed best?
- Which location generated the highest sales?
- Which products are declining?
- What percentage of sales came from each product?
- What is the average transaction value?
- Which sales representative performed best?
These are questions that Excel for Data Analysis can help answer.
This is why Excel is still an important practical skill for people working with business information.
Who Needs Excel for Data Analysis?
You do not have to be a professional data analyst before learning Excel for Data Analysis.
The skill can benefit many different people.
Students
Students can use Excel for:
- Research
- Assignments
- Survey analysis
- Academic projects
- Statistics
- Data organization
- Presentations
Graduates
Graduates can use Excel Data Analysis skills to strengthen their professional capabilities and become more comfortable working with business information.
Business Owners
Entrepreneurs can use Excel for Data Analysis to monitor:
- Revenue
- Expenses
- Inventory
- Customers
- Profit
- Sales
- Business performance
Administrative Professionals
Excel is frequently useful for preparing reports, managing records, organizing information and analyzing operational data.
Finance Professionals
Excel can support financial calculations, reporting, budgeting and analysis.
Marketing Professionals
Marketing teams can use Excel to analyze campaign results, customer information, leads and sales performance.
Aspiring Data Analysts
For people who want to become data analysts, Excel for Data Analysis can provide a practical starting point before moving into more advanced tools.
What Can You Do With Excel for Data Analysis?
One of the reasons Excel remains useful is its flexibility.
You can use Excel for Data Analysis to perform many activities, including:
- Data collection
- Data organization
- Data cleaning
- Data transformation
- Data validation
- Calculations
- Sorting
- Filtering
- Statistical analysis
- Lookup operations
- PivotTable analysis
- Data visualization
- Dashboard development
- Business reporting
- Trend analysis
- Performance analysis
Let’s examine some of the most important areas.
1. Data Organization in Excel
Before you can perform effective Excel for Data Analysis, your data needs to be organized properly.
A basic dataset could look like this:
| Date | Product | Location | Quantity | Revenue |
|---|---|---|---|---|
| Jan 5 | Laptop | Port Harcourt | 2 | ₦900,000 |
| Jan 8 | Monitor | Lagos | 5 | ₦750,000 |
| Jan 12 | Keyboard | Abuja | 10 | ₦250,000 |
| Jan 15 | Laptop | Port Harcourt | 1 | ₦450,000 |
Each column represents a variable.
Each row represents a record.
This structure makes it easier to use Excel’s analytical tools.
A well-organized dataset is the foundation of effective Excel Data Analysis.
2. Data Cleaning in Excel
Data cleaning is one of the most important steps in Excel for Data Analysis.
Real-world data often contains errors.
You might find:
- Duplicate records
- Missing values
- Incorrect spellings
- Extra spaces
- Incorrect dates
- Inconsistent capitalization
- Invalid entries
- Incorrect numbers
For example:
Port Harcourt
port harcourt
PORT HARCOURT
Port-Harcourt
A human can understand that these probably refer to the same location.
Excel, however, may treat them as different text values.
Before conducting analysis, you need to standardize the data.
Useful Excel data-cleaning tools and functions include:
- Remove Duplicates
- Find and Replace
- TRIM
- CLEAN
- LEFT
- RIGHT
- MID
- TEXTSPLIT
- Flash Fill
- Data Validation
Learning Excel Data Cleaning is therefore an important part of becoming competent in Excel for Data Analysis.
3. Excel Formulas for Data Analysis
Formulas are at the heart of Excel for Data Analysis.
They allow you to perform calculations quickly and consistently.
SUM
The SUM function calculates totals.
=SUM(E2:E100)
For example, you could use SUM to calculate total sales.
AVERAGE
AVERAGE calculates the mean value.
=AVERAGE(E2:E100)
You could use it to calculate average revenue per transaction.
MIN
MIN identifies the smallest value.
=MIN(E2:E100)
MAX
MAX identifies the largest value.
=MAX(E2:E100)
COUNT
COUNT counts cells containing numerical values.
=COUNT(E2:E100)
COUNTA
COUNTA counts non-empty cells.
=COUNTA(A2:A100)
These functions are among the first tools beginners should understand when learning Excel for Data Analysis.
4. Logical Functions for Excel Data Analysis
Logical functions allow Excel to evaluate conditions.
Important functions include:
- IF
- AND
- OR
- IFS
- IFERROR
For example:
=IF(E2>=500000,"High","Low")
This formula can classify sales into two categories.
You could use similar logic to classify:
- High-performing products
- Low-performing products
- Employees meeting targets
- Customers by value
- Inventory status
- Business performance
This moves Excel beyond basic calculations and into practical data analysis.
5. XLOOKUP and Excel Data Analysis
Lookup functions are important when working with multiple tables.
XLOOKUP is particularly useful in modern Excel.
For example, imagine you have a product code and want Excel to return the corresponding product price.
A lookup formula can connect the information between two datasets.
This is useful when working with:
- Product databases
- Customer records
- Employee information
- Inventory
- Price lists
- Sales records
Understanding lookup functions can significantly improve your Excel for Data Analysis workflow.
6. Sorting and Filtering Data
Sorting and filtering are simple but powerful Excel Data Analysis techniques.
You can sort data by:
- Highest revenue
- Lowest revenue
- Customer name
- Date
- Product
- Quantity
- Location
You can also filter your dataset.
For example:
Show all sales made in Port Harcourt.
Or:
Show all transactions above ₦500,000.
Or:
Show only laptop sales from January.
Instead of manually searching through thousands of records, Excel can instantly display the information you need.
7. Excel Tables for Data Analysis
Excel Tables make datasets easier to manage.
Converting a dataset into a proper Excel Table can provide:
- Automatic filtering
- Structured references
- Easier formulas
- Automatic expansion
- Consistent formatting
- Easier data management
For anyone serious about learning Excel for Data Analysis, working with structured tables is an important skill.
8. PivotTables for Excel Data Analysis
If you are learning Excel for Data Analysis, you should pay serious attention to PivotTables.
PivotTables are among the most useful Excel tools for summarizing large datasets.
Imagine you have 50,000 sales records.
You want to know:
How much did each city generate?
Instead of manually calculating each city, you can create a PivotTable.
For example:
| Location | Revenue |
|---|---|
| Port Harcourt | ₦12,500,000 |
| Lagos | ₦18,300,000 |
| Abuja | ₦9,700,000 |
| Enugu | ₦5,400,000 |
You can also analyze the same data by:
- Product
- Month
- Customer
- Salesperson
- Category
- Region
This makes PivotTables an essential part of practical Excel Data Analysis.
9. PivotCharts and Excel Data Visualization
Once you have summarized your data, you may want to communicate your findings visually.
PivotCharts can help transform summarized information into visual reports.
For example, you could create a chart showing:
Monthly Revenue
January → ₦2.1m
February → ₦2.8m
March → ₦3.4m
April → ₦2.9m
Instead of reading hundreds of rows, a decision-maker can quickly see the trend.
This is an important principle of Excel for Data Analysis:
Good analysis should make information easier to understand.
10. Data Visualization in Excel
Excel provides several chart types.
Common options include:
- Column charts
- Bar charts
- Line charts
- Pie charts
- Scatter charts
- Area charts
- Combo charts
The important skill is not simply knowing how to create charts.
You should understand which visualization is appropriate for the question you are trying to answer.
For example:
Line Chart
Useful for showing changes over time.
Bar Chart
Useful for comparing categories.
Scatter Plot
Useful for exploring relationships between variables.
Column Chart
Useful for comparing values across categories.
Good Excel Data Analysis requires both technical and analytical judgment.
11. Conditional Formatting
Conditional formatting helps highlight important information automatically.
For example, you could highlight:
- Sales above target
- Low inventory
- High expenses
- Poor performance
- Top customers
- Negative values
Suppose your target is ₦500,000.
You can configure Excel to visually highlight sales that exceed the target.
This allows important patterns to become easier to identify.
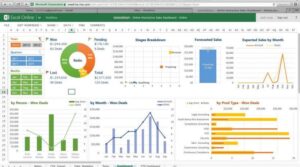
12. Excel Dashboards for Data Analysis
An Excel dashboard brings important information into one visual interface.
A sales dashboard might contain:
Total Revenue
₦50,000,000
Total Orders
2,450
Average Order Value
₦20,408
Best Product
Product A
Best Location
Port Harcourt
Monthly Sales Trend
A line chart showing sales over time.
Sales by Location
A bar chart comparing cities.
This is where Excel for Data Analysis becomes particularly powerful for business reporting.
A dashboard does not simply display numbers.
It should help someone understand what is happening.
Excel for Data Analysis: From Raw Data to Business Insight
A good data analysis process can be represented as:
Raw Data → Clean Data → Organized Data → Analysis → Visualization → Insight → Decision
Let’s use a practical example.
Imagine a business in Port Harcourt sells smartphones.
The company has thousands of transactions.
The management team wants to know:
Which products and locations are generating the highest revenue?
An Excel Data Analysis workflow could look like this:
Step 1: Import the data
Bring the sales records into Excel.
Step 2: Inspect the dataset
Identify missing information and errors.
Step 3: Clean the data
Remove duplicates and standardize names.
Step 4: Calculate revenue
Use formulas where necessary.
Step 5: Create an Excel Table
Structure the dataset for easier analysis.
Step 6: Create a PivotTable
Summarize sales by product and location.
Step 7: Create charts
Visualize the results.
Step 8: Build a dashboard
Bring the most important metrics together.
Step 9: Interpret the results
Identify the strongest and weakest areas.
Step 10: Communicate the insight
Explain what the business should understand from the analysis.
That is Excel for Data Analysis in practice.
Excel for Data Analysis Example for a Nigerian Business
Consider a small fashion business operating in Port Harcourt.
The business records:
- Customer
- Product
- Quantity
- Price
- Date
- Location
- Salesperson
The owner wants to understand why some months generate higher sales.
Using Excel for Data Analysis, the business can:
- Clean transaction records.
- Calculate total revenue.
- Group transactions by month.
- Compare product categories.
- Identify high-value customers.
- Analyze sales by location.
- Create a monthly sales chart.
- Build a dashboard.
- Identify sales trends.
- Use the findings to support business decisions.
This demonstrates why practical Excel Data Analysis skills can be valuable beyond the classroom.
Excel for Data Analysis in Port Harcourt
Port Harcourt is a major commercial and economic centre, with businesses operating across areas such as:
- Oil and gas
- Logistics
- Retail
- Education
- Hospitality
- Professional services
- Technology
- Real estate
- Healthcare
- Small and medium-sized businesses
These organizations generate information every day.
Sales records.
Customer records.
Financial records.
Inventory data.
Operational reports.
Marketing information.
Employee information.
The ability to organize and analyze such information is increasingly useful.
This is why learning Excel for Data Analysis in Port Harcourt should not be limited to theoretical lessons.
Learners should practise with realistic problems.
They should build projects.
They should learn how to explain their findings.
They should develop portfolios that demonstrate what they can actually do.
That is the philosophy behind practical technology education at Potenmunia Tech School.
Why Potenmunia Tech School Is Different
At Potenmunia Tech School, we believe technology education should go beyond lectures, certificates and theoretical knowledge.
Our approach is designed around a simple principle:
Competence matters more than certificates alone.
A certificate can demonstrate that someone completed a programme.
A practical project can demonstrate what the learner can actually do.
That distinction influences how we approach technology training.
Our Core Pillars
1. Practical Technology Training
Our training emphasizes learning by doing.
When learning Excel for Data Analysis, learners should not only watch an instructor create formulas.
They should practise.
They should work with datasets.
They should make mistakes.
They should troubleshoot.
They should analyze.
They should build.
That process creates stronger practical capability.
2. Career and Income Readiness
Learning Excel should connect to real opportunities.
Our approach helps learners understand how technical skills can potentially support:
- Employment
- Remote work
- Freelancing
- Business support
- Professional advancement
- Entrepreneurship
We want learners to understand not only what Excel can do, but also where Excel skills can create value.
3. Innovation and Entrepreneurship
Technology should not only be viewed as a path to employment.
It can also be a tool for creating solutions.
A learner who understands Excel for Data Analysis can identify business problems that involve:
- Reporting
- Sales tracking
- Inventory
- Customer information
- Business performance
- Financial records
The question becomes:
What problem can I solve with what I have learned?
That mindset is important for innovation and entrepreneurship.
4. AI and Future Skills Integration
The modern workplace is changing.
Artificial intelligence is increasingly being used to support productivity, analysis, research and business processes.
At Potenmunia Tech School, we believe learners should understand how AI can complement their technical skills.
For Excel Data Analysis, AI can potentially assist with:
- Formula explanations
- Data-analysis ideas
- Workflow development
- Productivity
- Troubleshooting
- Documentation
- Learning new concepts
However, learners still need to understand the underlying data and verify results.
AI should strengthen competence, not replace competence.
5. Mentorship Ecosystem
Learning a technical skill can become difficult when a learner does not know what to learn next.
Mentorship can help learners:
- Identify skill gaps
- Improve weak areas
- Understand career directions
- Review projects
- Develop professional confidence
- Make better learning decisions
At Potenmunia Tech School, learning is designed to extend beyond classroom instruction.
6. Real-World Experience
Real-world projects provide evidence.
Instead of saying:
“I know Excel.”
A learner should be able to demonstrate:
“I cleaned this dataset, analyzed the information, created a dashboard and presented the findings.”
That is the difference between theoretical knowledge and practical competence.
What Makes the Potenmunia Learning Experience Different?
100% Practical Learning
We emphasize learning through application.
Learners spend meaningful time practising rather than relying exclusively on lectures.
One-on-One Mentorship
Where applicable, learners receive personalized guidance to identify gaps and improve their capabilities.
Real Project Experience
Projects help learners apply technology to practical problems.
Career Portfolio Building
Learners are encouraged to transform completed projects into evidence of their abilities.
Job-Readiness Support
We go beyond technical instruction by helping learners think about professional opportunities and workplace expectations.
AI Integration and Interview Preparation
Learners are exposed to modern AI-assisted workflows while developing professional confidence.
Industry Alignment
Our learning approach considers the changing requirements of the digital workplace.
Long-Term Career Vision
We encourage learners to think beyond completing a course.
The bigger question is:
Where can this skill take me over the next several years?
Building an Excel for Data Analysis Portfolio
If you want to demonstrate your Excel Data Analysis skills, do not rely only on a certificate.
Build projects.
A beginner could create an:
Excel Sales Analysis Project
Analyze:
- Total sales
- Sales by month
- Sales by product
- Sales by location
- Best-performing product
- Lowest-performing product
Excel Expense Analysis Project
Analyze:
- Monthly expenses
- Expense categories
- Highest expenses
- Average spending
- Monthly spending trends
Excel Inventory Analysis Project
Analyze:
- Stock levels
- Product movement
- Low-stock products
- Inventory value
- Reorder requirements
Excel Customer Analysis Project
Analyze:
- Number of customers
- Customer purchases
- Customer value
- Purchase frequency
- Revenue contribution
Excel Business Dashboard Project
Combine:
- KPIs
- PivotTables
- Charts
- Filters
- Business insights
These projects can become portfolio evidence.
What Should a Beginner Learn in Excel for Data Analysis?
A structured learning path is better than trying to learn everything at once.
Level 1: Excel Fundamentals
Learn:
- Excel interface
- Cells
- Rows
- Columns
- Worksheets
- Workbooks
- Cell references
- Formatting
- Basic calculations
Level 2: Excel Formulas
Learn:
- SUM
- AVERAGE
- COUNT
- COUNTA
- MIN
- MAX
- IF
- IFERROR
Level 3: Data Cleaning
Learn:
- Remove Duplicates
- Find and Replace
- TRIM
- CLEAN
- Text functions
- Data Validation
- Date handling
Level 4: Data Management
Learn:
- Excel Tables
- Sorting
- Filtering
- Conditional Formatting
Level 5: Excel Data Analysis
Learn:
- XLOOKUP
- INDEX
- MATCH
- Logical formulas
- Statistical functions
- PivotTables
Level 6: Data Visualization
Learn:
- Charts
- PivotCharts
- Chart selection
- Data storytelling
Level 7: Excel Dashboards
Learn:
- KPI design
- Dashboard structure
- Interactive filters
- Charts
- Summary reports
Level 8: Real-World Projects
Apply everything you have learned to realistic datasets.
Level 9: Portfolio Development
Document your projects.
Level 10: Career Development
Learn how to communicate your skills professionally and prepare for opportunities.
Excel for Data Analysis vs. Basic Excel
There is a difference between knowing Excel and knowing how to use Excel for Data Analysis.
Basic Excel
You know how to:
- Enter information
- Format cells
- Add numbers
- Create simple tables
Excel for Data Analysis
You can:
- Clean a dataset
- Identify patterns
- Calculate metrics
- Compare categories
- Analyze trends
- Create PivotTables
- Build visualizations
- Develop dashboards
- Interpret findings
- Communicate insights
The second level represents a deeper analytical capability.
Common Excel for Data Analysis Mistakes Beginners Make
1. Learning Formulas Without Understanding Questions
Do not start by asking:
“Which formula should I use?”
Start by asking:
“What do I want to find out?”
Then identify the Excel tool that can answer the question.
2. Ignoring Data Quality
Bad data can produce bad conclusions.
Always inspect and clean your dataset before analysis.
3. Creating Unnecessary Charts
Not every number needs a chart.
Choose visualizations that make the information easier to understand.
4. Focusing Too Much on Formatting
A beautiful spreadsheet can still contain poor analysis.
Prioritize:
Accuracy → Analysis → Insight → Communication → Presentation
5. Watching Tutorials Without Practising
You cannot develop practical Excel Data Analysis competence by watching videos alone.
You need to practise.
6. Not Building Projects
Projects turn knowledge into evidence.
If you want employers or clients to understand your ability, give them something concrete to see.
How Long Does It Take to Learn Excel for Data Analysis?
There is no universal timeline.
Learning speed depends on:
- Previous experience
- Practice time
- Learning method
- Complexity of the topics
- Consistency
- Access to mentorship
- Number of projects completed
The most important factor is not how quickly you finish a course.
It is whether you can independently apply what you learned.
A useful learning cycle is:
Learn → Practise → Build → Review → Improve → Showcase
Can Excel for Data Analysis Lead to a Career?
Excel alone does not guarantee employment.
However, practical Excel Data Analysis skills can complement many professional roles.
Depending on your broader skill set, Excel can be relevant to areas such as:
- Data analysis
- Business analysis
- Finance
- Accounting
- Operations
- Administration
- Sales
- Marketing
- Reporting
- Business intelligence
For people pursuing data analytics as a career, Excel can also serve as one component of a broader learning pathway.
You may eventually add:
- SQL
- Power BI
- Statistics
- Python
- Databases
- Business intelligence
- Data visualization
The important thing is to build progressively.
Frequently Asked Questions About Excel for Data Analysis
What is Excel for Data Analysis?
Excel for Data Analysis is the use of Microsoft Excel to organize, clean, calculate, summarize, visualize and interpret data to generate useful insights.
Is Excel good for Data Analysis?Yes.
Excel can perform a wide range of data analysis tasks, including data cleaning, calculations, filtering, PivotTables, visualization, reporting and dashboard development.
Can a complete beginner learn Excel for Data Analysis?
Yes.
A beginner can start with Excel fundamentals and gradually progress into formulas, data cleaning, PivotTables, charts and dashboards.
Do I need coding to learn Excel for Data Analysis?
No.
Many Excel Data Analysis tasks can be completed without traditional programming.
However, learning SQL, Python or other technologies later can expand your analytical capabilities.
What Excel functions should I learn first for Data Analysis?
Start with:
- SUM
- AVERAGE
- COUNT
- COUNTA
- MIN
- MAX
- IF
- IFERROR
- XLOOKUP
Then progress to more advanced functions.
Are PivotTables important in Excel for Data Analysis?
Yes.
PivotTables are extremely useful for summarizing and exploring large datasets and should be part of a practical Excel Data Analysis learning path.
Can I create a dashboard with Excel?
Yes.
Excel can be used to create dashboards containing KPIs, charts, summaries, filters and other reporting elements.
Can Excel be used for business analysis?
Yes.
Businesses can use Excel for Data Analysis to examine:
- Sales
- Revenue
- Expenses
- Inventory
- Customers
- Employees
- Marketing
- Operations
- Performance
Where can I learn Excel for Data Analysis in Port Harcourt?
Learners looking for practical technology training in Port Harcourt can explore Potenmunia Tech School, whose learning approach emphasizes practical training, real projects, mentorship, portfolio development, career readiness and AI integration.
Is Excel for Data Analysis useful in Nigeria?
Yes.
Organizations and businesses across Nigeria generate large amounts of operational, financial, customer and sales information.
Developing the ability to organize and analyze such information can be a valuable professional skill.
Excel for Data Analysis Learning Roadmap
Here is a simple progression for beginners:
Excel Fundamentals
↓
Formulas and Functions
↓
Data Cleaning
↓
Sorting and Filtering
↓
Excel Tables
↓
XLOOKUP and Advanced Functions
↓
PivotTables
↓
Data Visualization
↓
Excel Dashboards
↓
Real-World Projects
↓
Portfolio Development
↓
Career Preparation
This progression helps transform Excel from a basic spreadsheet application into a practical analytical tool.
Why Choose Potenmunia Tech School for Excel and Data Analysis Training?
At Potenmunia Tech School, we believe that technology education should produce more than course completion.
We focus on helping learners develop capabilities they can demonstrate.
Our approach combines:
Practical Technology Training
Career & Income Readiness
Innovation & Entrepreneurship
AI & Future Skills Integration
Mentorship
Real-World Experience
This means our focus is not simply:
“Did you complete the Excel course?”
Our bigger question is:
“What can you actually do with Excel now?”
We Build Competence, Not Just Certificates
A certificate can show that someone completed a programme.
Competence demonstrates what someone can actually do.
That is why practical projects, portfolio development, mentorship and application are important parts of the Potenmunia learning philosophy.
For Excel for Data Analysis, competence could mean being able to:
- Import a dataset
- Clean the data
- Remove duplicates
- Correct inconsistencies
- Use formulas
- Perform calculations
- Apply filters
- Use XLOOKUP
- Create PivotTables
- Analyze trends
- Create charts
- Build dashboards
- Explain findings
- Present insights
That is practical capability.
Our Promise to Every Learner
At Potenmunia Tech School, our learning philosophy can be summarized in six steps:
Learn the Skill
Understand the concepts.
Practise the Skill
Apply the concepts repeatedly.
Build With the Skill
Create practical projects.
Showcase the Skill
Develop evidence of your capabilities.
Prepare for the Opportunity
Develop professional and career readiness.
Continue Growing
Keep developing as technology changes.
Conclusion on Excel for Data Analysis
Excel for Data Analysis is more than learning Excel formulas.
It is the ability to work with information and turn that information into useful understanding.
You can begin with basic Excel skills and gradually develop capabilities in:
- Data cleaning
- Formulas
- Functions
- Lookup operations
- Sorting
- Filtering
- PivotTables
- Data visualization
- Dashboards
- Business reporting
- Real-world analysis
But the ultimate goal should not be:
“I know Excel.”
The goal should be:
“I can use Excel to solve a real problem.”
That is the mindset that separates basic software knowledge from practical data analysis competence.
At Potenmunia Tech School in Port Harcourt, Nigeria, we are committed to a practical approach to technology education—one that encourages learners to learn, practise, build, showcase and prepare for opportunities.
If you are beginning your journey into data analysis, Excel for Data Analysis can be an excellent place to start.
And if you want to take that skill beyond tutorials and into practical projects, portfolio development, mentorship, AI-enabled workflows and career preparation, the Potenmunia approach is built around exactly that philosophy.
Learn the skill. Practise the skill. Build with the skill. Showcase the skill. Prepare for the opportunity.
About Potenmunia Tech School
Potenmunia Tech School is a practical technology education institution in Port Harcourt focused on helping learners develop relevant digital skills, practical experience, professional confidence and career readiness.
Our core areas of focus include:
- Practical technology training
- Data and digital skills
- AI and future skills
- Career and income readiness
- Innovation and entrepreneurship
- Mentorship
- Real-world project experience
- Portfolio development
We believe technology education should prepare learners for the real digital economy.
We build competence, not just certificates.
Ready to Learn Excel for Data Analysis?
If you are in Port Harcourt or anywhere in Nigeria and want to develop practical Excel and data analysis skills, start with the right mindset:
Learn. Practise. Build. Showcase. Prepare.
Businesses today generate enormous amounts of data.
Sales transactions, customer information, financial records, employee performance, marketing campaigns, inventory, website activity and operational information can all produce valuable data.
But raw data does not automatically create value.
The real advantage comes from knowing how to analyze data, discover patterns, communicate insights, and support better decisions.
That is why Power BI for Data Analysis has become an important skill for people interested in data analytics, business intelligence, and modern digital careers.
Microsoft describes Power BI as a business analytics platform that helps users connect, visualize, and share data to produce actionable insights.
At Potenmunia Tech School in Port Harcourt, Rivers State, Nigeria, we approach Power BI from a practical perspective.
We do not believe technology education should end when a learner receives a certificate.
We believe learners should be able to learn the skill, practise the skill, build with the skill, showcase the skill and prepare for the opportunity.
That is the philosophy behind our practical approach to Power BI for Data Analysis.
What Is Power BI for Data Analysis?
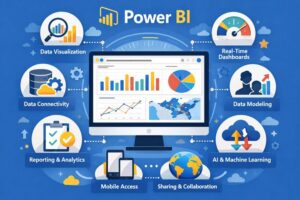
Power BI for Data Analysis means using Microsoft Power BI to collect, prepare, transform, model, analyze and visualize data so that useful information can be discovered and communicated.
In simple terms:
Power BI for Data Analysis turns raw data into understandable insights.
Imagine a company has thousands of sales records.
The raw dataset might contain:
- Date
- Product
- Customer
- Location
- Quantity
- Revenue
- Cost
- Profit
- Salesperson
Looking through thousands of rows manually can make it difficult to understand what is happening.
With Power BI for Data Analysis, an analyst can transform that information into an interactive analytical report containing:
- Total revenue
- Total profit
- Sales trends
- Best-selling products
- Regional performance
- Customer performance
- Monthly comparisons
- Profit margins
- Key performance indicators
This is one of the central purposes of Power BI for Data Analysis: making data easier to explore, understand and use.
Why Power BI for Data Analysis Matters
The modern workplace increasingly depends on data.
Organizations need people who can move beyond collecting information and help turn information into useful decisions.
Microsoft’s current Power BI learning resources describe data analysts as professionals who prepare, model, visualize and analyze data to produce insights that support business decisions.
This makes Power BI for Data Analysis relevant to people interested in careers involving:
- Data analysis
- Business intelligence
- Business reporting
- Data visualization
- Performance monitoring
- Business analytics
- Decision support
The important point is that Power BI is not just about creating attractive charts.
Power BI for Data Analysis is about asking better questions of data and communicating useful answers.
How Power BI for Data Analysis Works
A strong Power BI project normally follows a logical process.
1. Define the Business Question
Before importing data, identify what you need to understand.
For example:
Business question:
How is our business performing across products, locations and months?
That question can lead to analytical requirements such as:
- What is total revenue?
- What is total profit?
- Which product sells the most?
- Which location performs best?
- Which month generated the highest revenue?
- Is performance improving?
- Which areas require attention?
This is an important part of Power BI for Data Analysis because a dashboard without a clear purpose can become a collection of disconnected visuals.
2. Connect Power BI to Your Data
Power BI can connect to many types of data sources.
These can include:
- Excel
- CSV files
- Relational databases
- Cloud services
- Web sources
- Other supported business data sources
Microsoft’s Power BI documentation explains that Power BI Desktop can connect to files, databases, web sources and other data environments.
For a beginner learning Power BI for Data Analysis, Excel and CSV datasets are often excellent places to start.
The important lesson is not simply learning how to click Get Data.
The learner needs to understand:
Where does the data come from?
What does each field represent?
Is the data trustworthy?
Is the structure appropriate for analysis?
3. Clean the Data
One of the most important stages of Power BI for Data Analysis is preparing the data.
Raw data can contain:
- Missing values
- Duplicate records
- Incorrect data types
- Spelling inconsistencies
- Unnecessary columns
- Incorrect dates
- Empty rows
- Inconsistent categories
Power Query is an important part of the Power BI workflow for extracting, transforming, cleaning and loading data. Microsoft provides dedicated Power BI training on profiling, cleaning, shaping and loading data before modelling.
For example, a location column might contain:
- Port Harcourt
- port harcourt
- PORT HARCOURT
- P/Harcourt
To a human, these may represent the same location.
To a computer model, inconsistent values can create analytical problems.
Good Power BI for Data Analysis therefore starts with good data preparation.
4. Transform the Data
Data transformation involves changing information into a structure that is easier to analyze.
This may involve:
- Renaming columns
- Changing data types
- Removing unnecessary fields
- Splitting columns
- Combining columns
- Replacing values
- Filtering records
- Creating calculated fields
- Reshaping datasets
Microsoft’s Power BI documentation provides dedicated guidance for transforming, shaping and modelling data.
This is where learners begin to understand an important principle:
A professional dashboard is only as good as the data behind it.
5. Build the Data Model
Data modelling is another major component of Power BI for Data Analysis.
Imagine a business has separate tables for:
Sales
- Sale ID
- Date
- Product ID
- Customer ID
- Quantity
- Revenue
Products
- Product ID
- Product Name
- Category
- Price
Customers
- Customer ID
- Customer Name
- Location
- Customer Type
Dates
- Date
- Month
- Quarter
- Year
These tables need appropriate relationships so Power BI can analyze them together.
Microsoft recommends thoughtful data modelling and provides specific guidance around relationships, star schema and modelling best practices.
Strong Power BI for Data Analysis therefore requires more than knowing how to create charts.
You need to understand the structure of the data.
6. Use DAX for Data Analysis
DAX stands for Data Analysis Expressions.
It is the formula language used in Power BI for creating calculations and analytical measures. Microsoft’s Power BI documentation identifies DAX as the formula language for calculations in Power BI and related Microsoft analytical technologies.
For example:
Total Revenue = SUM(Sales[Revenue])
Another example could be:
Total Quantity = SUM(Sales[Quantity])
And a business might calculate:
Average Order Value = DIVIDE([Total Revenue], [Total Orders])
These calculations allow analysts to move from simply displaying data to analyzing data.
That is why DAX is an important part of advanced Power BI for Data Analysis.
7. Analyze the Data
Once the data is prepared and modelled, the next stage is analysis.
You may want to discover:
- Trends
- Patterns
- Outliers
- Growth
- Decline
- Differences
- Relationships
- Performance gaps
Microsoft’s Power BI training includes advanced analytical capabilities such as statistical summaries, outlier identification, clustering, time-series analysis and AI-assisted insights.
For example, a business may discover:
Sales increased during certain months but profit did not increase at the same rate.
That immediately creates another question:
Why?
Perhaps costs increased.
Perhaps discounts increased.
Perhaps a particular product category has lower margins.
This demonstrates the real purpose of Power BI for Data Analysis.
The dashboard does not make the business decision.
It helps people discover the information needed to make the decision.
8. Build Professional Power BI Visualizations
After analysis, the next stage is presenting the information clearly.
Power BI provides many visualization options.
Cards
Use cards for important KPIs such as:
- Revenue
- Profit
- Orders
- Customers
Line Charts
Use line charts to display trends over time.
Bar Charts
Use bar charts to compare categories.
Tables
Use tables when detailed records are important.
Maps
Use maps when geographic analysis adds value.
Slicers
Use slicers to allow users to interactively filter information.
Microsoft’s documentation includes guidance for creating reports, using visuals, filters and interactive reporting features.
How to Build a Professional Power BI Dashboard
A professional Power BI dashboard should not simply contain as many visuals as possible.
It should have a purpose.
Here is an example dashboard structure.
Dashboard Header
Sales Performance Dashboard
KPI Section
- Total Revenue
- Total Profit
- Total Orders
- Average Order Value
Trend Section
Monthly Revenue Trend
A line chart can show how revenue changes across the year.
Product Section
Top Products by Revenue
A bar chart can identify the strongest-performing products.
Location Section
Sales by Location
This can help management compare locations.
Performance Section
Revenue vs Target
This can help identify whether performance is meeting expectations.
Filter Section
Users can filter by:
- Date
- Product
- Location
- Category
- Sales representative
This creates a more useful Power BI for Data Analysis experience because the user can explore the information instead of simply viewing a static chart.
Power BI for Data Analysis: Dashboard Design Principles
Professional Power BI dashboard development requires thoughtful design.
Keep the Dashboard Simple
Avoid unnecessary visuals.
Create a Visual Hierarchy
Important information should be immediately visible.
Use Consistent Formatting
Maintain consistency in:
- Fonts
- Numbers
- Labels
- Spacing
- Alignment
- Visual structure
Use Meaningful Titles
Instead of:
Chart 1
Use:
Monthly Revenue Trend
Instead of:
Chart 2
Use:
Top 10 Products by Revenue
This makes the dashboard easier to understand.
Show Context
A number becomes more useful when users can compare it.
For example:
Revenue: ₦125M
is more meaningful when accompanied by:
+14% compared with the previous period
The purpose of Power BI for Data Analysis is not merely to display numbers.
It is to communicate meaning.
Power BI Dashboard vs Power BI Report
A common question among people learning Power BI for Data Analysis is:
What is the difference between a Power BI dashboard and a Power BI report?
They are related, but they are not identical.
Microsoft explains that Power BI Desktop is primarily used for building reports and data models, while the Power BI service provides capabilities for publishing, sharing and collaboration.
A simple way to understand the distinction is:
Report: Detailed analysis and exploration.
Dashboard: High-level monitoring and decision support.
Both can be important in a professional Power BI for Data Analysis workflow.
A Practical Power BI for Data Analysis Example in Port Harcourt
Let’s imagine a fictional retail business operating in Port Harcourt.
The company has one year of sales records.
Its management wants to understand:
- Total revenue
- Total profit
- Best-performing products
- Monthly sales
- Customer performance
- Location performance
A learner working on a Power BI for Data Analysis project could create:
Page 1: Executive Overview
- Revenue
- Profit
- Orders
- Customers
- Monthly trend
Page 2: Product Analysis
- Products by revenue
- Products by quantity
- Product categories
- Profit by product
Page 3: Customer Analysis
- Customer segments
- Customer revenue
- Repeat purchases
Page 4: Location Analysis
- Sales by location
- Revenue by area
- Performance comparison
This becomes a practical portfolio project because it demonstrates more than the ability to create a chart.
It demonstrates an analytical workflow.
Power BI for Data Analysis and Real-World Business Questions
The strength of Power BI for Data Analysis becomes clearer when you connect it to actual business questions.
Sales Question
Which products generate the most revenue?
Financial Question
Which products have the highest profit margins?
Customer Question
Which customer segments generate the most value?
Operations Question
Which areas are underperforming?
Management Question
Are we meeting our targets?
Marketing Question
Which campaigns generate the strongest results?
A professional analyst does not simply create charts.
The analyst starts with questions, works with data and communicates evidence.
Common Power BI for Data Analysis Mistakes
1. Starting With Visuals
Do not begin with:
Which chart looks nice?
Begin with:
What question are we trying to answer?
2. Ignoring Data Quality
Incorrect data can produce incorrect insights.
3. Creating Too Many Charts
A dashboard packed with visuals can become difficult to understand.
4. Ignoring Data Modelling
Poor relationships can affect analytical results.
5. Using DAX Without Understanding the Data
Writing formulas without understanding the model can create unreliable calculations.
6. Building a Dashboard Without a User
Always ask:
Who will use this dashboard?
A CEO, sales manager, financial analyst and operations manager may need completely different information.
Power BI for Data Analysis and Career Development
Learning Power BI for Data Analysis can form part of a broader data analytics career pathway.
Possible roles include:
- Data Analyst
- Business Intelligence Analyst
- Reporting Analyst
- Business Analyst
- Data Visualization Specialist
- Junior BI Developer
However, Power BI should not be viewed as the only skill required.
A strong data professional may also develop knowledge of:
- Excel
- SQL
- Statistics
- Data cleaning
- Data modelling
- Business analysis
- Data storytelling
- Python
- Artificial Intelligence
Microsoft’s current Power BI Data Analyst certification framework emphasizes preparing, modelling, visualizing and analyzing data, as well as managing and securing Power BI solutions.
This reinforces an important point:
Power BI for Data Analysis is a complete analytical skill area, not merely a chart-building exercise.
Building a Power BI Portfolio
One of the best ways to demonstrate Power BI for Data Analysis skills is through practical projects.
A learner could build:
1. Sales Dashboard
Analyze revenue, products, customers and locations.
2. Financial Dashboard
Analyze revenue, expenses, profit and financial trends.
3. Customer Dashboard
Analyze customer segments and purchasing behavior.
4. Marketing Dashboard
Analyze campaigns, leads and conversions.
5. Operations Dashboard
Analyze performance, targets and operational indicators.
A portfolio containing these projects can demonstrate practical capability to potential employers, clients and collaborators.
Why Learn Power BI for Data Analysis at Potenmunia Tech School?
This is where Potenmunia Tech School takes a different approach.
Our philosophy is simple:
We build competence, not just certificates.
Technology education should not end with someone knowing the definition of Power BI.
The learner should be able to use Power BI.
That means:
Learn the skill.
Practise the skill.
Build with the skill.
Showcase the skill.
Prepare for the opportunity.
100% Practical Learning
At Potenmunia Tech School, practical learning is central to our approach.
For Power BI for Data Analysis, practical learning can involve working with datasets, creating analytical models, developing calculations and building dashboards.
The objective is to move from:
Theory → Practice → Project → Portfolio
rather than:
Theory → Certificate
Real Project Experience
Real projects provide context.
Instead of learning Power BI only through isolated exercises, learners can work on scenarios that resemble real business problems.
For example:
Retail Sales Analysis
Customer Analytics
Financial Performance
Marketing Analytics
Business Performance Monitoring
This allows learners to understand how Power BI for Data Analysis can be applied beyond the classroom.
Career Portfolio Building
A professional Power BI learner should not only know how to use the software.
They should have evidence.
That evidence can include:
- Dashboard screenshots
- Project descriptions
- Data models
- Analytical questions
- Key findings
- Recommendations
- Project documentation
At Potenmunia Tech School, career portfolio development forms part of our broader focus on helping learners turn practical skills into professional evidence.
AI Integration and Power BI for Data Analysis
Artificial Intelligence is increasingly becoming part of modern data workflows.
Microsoft’s current Power BI documentation includes AI-related capabilities such as Copilot, Q&A and other features designed to support data exploration and report development.
But AI does not eliminate the need for analytical thinking.
A learner still needs to understand:
- The business problem
- The data
- The quality of the data
- The calculations
- The analytical model
- The meaning of the results
At Potenmunia Tech School, AI & Future Skills Integration is therefore part of our broader learning philosophy.
We want learners to understand not only today’s tools but also how emerging technology can improve modern professional workflows.
Mentorship at Potenmunia Tech School
Learning Power BI for Data Analysis can raise many questions.
For example:
- Why is my DAX calculation wrong?
- Why is my relationship not working?
- Why are my numbers different from the source?
- Which visual should I choose?
- How should I present my project?
- How do I explain my dashboard professionally?
- What should I learn after Power BI?
Mentorship can help learners approach these challenges with greater direction.
Our mentorship ecosystem is designed to support learners beyond classroom instruction.
Career and Income Readiness
A technology skill becomes more valuable when learners understand how it can be applied professionally.
Power BI knowledge can support opportunities involving:
- Business reporting
- Data analysis
- Business intelligence
- Freelance analytics
- Dashboard development
- Reporting automation
- Data visualization
However, opportunity does not come from knowing the name of a software package.
It comes from being able to demonstrate competence.
That is why Potenmunia focuses on:
Skills + Practice + Projects + Portfolio + Professional Preparation
Why Potenmunia Tech School in Port Harcourt?
For learners in Port Harcourt and across Nigeria, Potenmunia Tech School provides a technology-learning environment centered around practical skills, projects, mentorship, innovation and career development.
Our broader learning pillars include:
Practical Technology Training
Learners practise the tools and workflows used in real technology environments.
Career & Income Readiness
Learners explore how digital skills can connect to employment, remote work, freelancing and other professional opportunities.
Innovation & Entrepreneurship
Technology is presented not only as a route to employment but also as a tool for creating solutions, products and businesses.
AI & Future Skills Integration
Learners are introduced to ways AI can improve productivity, problem-solving and professional work.
Mentorship Ecosystem
Learning extends beyond classroom instruction through guidance and professional development.
Real-World Experience
Learners are encouraged to build projects based on practical problems.
What Makes Potenmunia Tech School Different?
Our learning experience is built around:
100% Practical Learning
Learn by doing.
One-on-One Mentorship
Receive guidance designed around individual learning and professional development needs where applicable.
Real Project Experience
Build projects that demonstrate the ability to apply technology.
Career Portfolio Building
Learn how to turn projects into professional evidence.
Job-Readiness Support
Develop technical and professional confidence.
AI Integration & Interview Preparation
Understand how AI is influencing modern work while preparing for professional opportunities.
Industry Alignment
Develop skills with awareness of changing technology requirements.
Long-Term Career Vision
Think beyond completing a course and begin developing a longer-term professional direction.
Professional Experience & Profile Development
Build technical capability alongside a stronger professional identity.
Power BI for Data Analysis: From Learning to Competence
The difference between knowing Power BI and being able to use Power BI professionally is practical application.
A learner who understands terminology may know what a dashboard is.
A competent learner can:
- Understand a business question.
- Identify relevant data.
- Clean the data.
- Transform the data.
- Build a data model.
- Create calculations.
- Analyze the information.
- Select appropriate visualizations.
- Build an interactive report.
- Explain the findings.
- Document the project.
- Present the work professionally.
That is the kind of progression we want learners to experience at Potenmunia Tech School.
Frequently Asked Questions About Power BI for Data Analysis
What is Power BI for Data Analysis?
Power BI for Data Analysis is the use of Microsoft Power BI to prepare, model, analyze and visualize data so that users can discover insights and support better decisions.
Is Power BI good for data analysis?
Yes. Power BI provides tools for connecting to data, transforming it, modelling it, creating calculations and developing interactive reports and dashboards.
Can beginners learn Power BI for Data Analysis?
Yes. Microsoft provides beginner-oriented Power BI learning resources, including guidance for connecting data, transforming information and creating reports.
Do I need advanced Excel before learning Power BI?
No. Excel experience can help, but you do not need to be an advanced Excel user to begin learning Power BI.
Is Power BI the same as Excel?
No. Excel is a spreadsheet application with broad capabilities, while Power BI is designed around data modelling, visualization, business intelligence and interactive reporting.
What can I build with Power BI?
You can build analytical reports and dashboards for areas such as:
- Sales
- Finance
- Marketing
- Customers
- Operations
- Human resources
- Business performance
Can Power BI help me become a data analyst?
Power BI can be an important part of a data analyst’s toolkit, but a strong data analyst also needs broader skills in areas such as data preparation, analysis, business understanding and communication.
Is DAX important for Power BI for Data Analysis?
Yes. DAX is the calculation language used in Power BI, and understanding measures and calculations becomes increasingly important as you move into more advanced Power BI for Data Analysis.
Can I build a Power BI portfolio?
Yes. You can build projects around sales, finance, marketing, customers, operations and other datasets and use them as evidence of practical capability.
Where can I learn Power BI in Port Harcourt?
Potenmunia Tech School provides practical technology education in Port Harcourt, with an approach centered on hands-on learning, real projects, mentorship and career development.
Why choose Potenmunia Tech School?
Because our philosophy goes beyond certificate completion.
We focus on developing practical competence, project experience, professional confidence, portfolio evidence and career readiness.
Power BI for Data Analysis: The Bigger Picture
Power BI for Data Analysis is ultimately about turning information into understanding.
A spreadsheet can contain thousands of rows.
A professional Power BI solution can help transform those rows into:
Information → Analysis → Insight → Decision
That is the real value.
Whether you are a student, graduate, professional, entrepreneur or aspiring data analyst, learning Power BI for Data Analysis can help you develop a practical understanding of how modern organizations use data.
But learning Power BI should not stop at watching tutorials.
You should build.
You should practise.
You should solve problems.
You should document your work.
You should create a portfolio.
You should learn how to communicate your findings.
And you should understand how your skills fit into the wider technology ecosystem.
Learn Power BI for Data Analysis With Potenmunia Tech School
At Potenmunia Tech School, our goal is to help learners move from simply knowing technology to being able to use technology confidently and practically.
Our approach can be summarized in one promise:
Learn the Skill. Practise the Skill. Build With the Skill. Showcase the Skill. Prepare for the Opportunity.
That is what Power BI for Data Analysis should mean at Potenmunia Tech School.
Not just another certificate.
Not just another software skill.
Not just another classroom lesson.
Competence.
Practical experience.
Projects.
Portfolio.
Professional preparation.
Potenmunia Tech School
Building practical technology competence for the digital economy in Port Harcourt, Rivers State, Nigeria and beyond.
For general background information about Power BI and related concepts, readers can also consult Wikipedia.
Advanced Excel for Data Analysis is one of the most practical technology skills professionals can develop for working with business information, reports, financial records, sales data, customer information and operational datasets.
Excel is widely recognised as a spreadsheet and data-analysis tool, offering functions, charts, Pivot Tables and other capabilities for organising and analysing information.
But learning Advanced Excel for Data Analysis is about much more than learning formulas.
It is about learning how to take raw data, organise it, analyse it, identify meaningful patterns, create professional reports and communicate insights that can support better decisions.
At Potenmunia Tech School in Port Harcourt, Nigeria, we approach Advanced Excel for Data Analysis from a practical perspective.
Our goal is not simply to teach learners Excel commands.
Our goal is to help learners:
Learn the skill. Practise the skill. Build with the skill. Showcase the skill. Prepare for the opportunity.

What Is Advanced Excel for Data Analysis?
Advanced Excel for Data Analysis is the use of advanced Excel formulas, functions, tables, Pivot Tables, charts, data-cleaning techniques, dashboards and data-modelling features to transform raw information into useful insights.
Basic Excel can help you:
- Enter information
- Format spreadsheets
- Perform simple calculations
- Create basic tables
- Prepare simple reports
Advanced Excel for Data Analysis goes further.
It helps you:
- Analyse large datasets
- Clean and organise data
- Use advanced formulas
- Perform conditional calculations
- Search and retrieve information
- Summarise datasets with Pivot Tables
- Compare business performance
- Identify trends
- Build interactive reports
- Create professional dashboards
- Present analytical findings
The real value of Advanced Excel for Data Analysis is therefore not the number of formulas you know.
It is your ability to use Excel to answer meaningful questions.
Why Advanced Excel for Data Analysis Is Important
Modern organisations generate enormous amounts of information.
A business may have data about:
- Customers
- Products
- Sales
- Revenue
- Expenses
- Employees
- Inventory
- Marketing
- Projects
- Operations
Raw data alone does not automatically provide useful information.
Someone needs to organise the data, analyse it and communicate what it means.
That is where Advanced Excel for Data Analysis becomes valuable.
With the right Excel skills, a professional can transform thousands of rows of information into a structured report that helps answer questions such as:
- Which product generated the highest revenue?
- Which month had the strongest sales?
- Which salesperson performed best?
- Which location generated the most revenue?
- Which products are underperforming?
- How are expenses changing?
- What percentage of total sales came from each category?
- What trends can be identified from historical information?
These are practical Advanced Excel for Data Analysis questions.
Advanced Excel for Data Analysis Starts With Clean Data
Before creating a dashboard or Pivot Table, the data must be properly organised.
This is one of the most important principles in Advanced Excel for Data Analysis.
Poor-quality data can produce poor-quality analysis.
For example, imagine a sales spreadsheet containing:
| Date | Product | Location | Salesperson | Revenue |
|---|---|---|---|---|
| 01/01/2026 | Laptop | Port Harcourt | John | ₦450,000 |
| 02/01/2026 | Monitor | Port Harcourt | Mary | ₦180,000 |
| 03/01/2026 | Laptop | PH | John | ₦450,000 |
Although the information looks simple, the different representations of Port Harcourt and PH could create problems when analysing the location field.
Effective Advanced Excel for Data Analysis therefore begins with:
- Consistent data
- Correct data types
- Proper column headings
- Removal of unnecessary blank rows
- Duplicate checking
- Correct date formatting
- Consistent naming
- Appropriate Excel Tables
Microsoft recommends clean, tabular data with column headers when creating Pivot Tables.
Advanced Excel Functions for Data Analysis
One of the biggest areas of Advanced Excel for Data Analysis is learning how to use functions to solve analytical problems.
You do not need to memorise every Excel function.
You need to understand which function is appropriate for the problem you are trying to solve.
IF Function for Advanced Excel Data Analysis
The IF function allows Excel to return different results depending on whether a condition is true or false.
For example, a business could classify sales performance into categories such as:
- High
- Medium
- Low
This allows raw numbers to become more meaningful categories.
That is an important part of Advanced Excel for Data Analysis because analysis often involves transforming numbers into information that people can understand.
SUMIFS for Advanced Excel Data Analysis
SUMIFS is particularly useful when you need to calculate totals based on multiple conditions.
Imagine a company has thousands of sales records.
You may want to calculate:
Total sales for laptops in Port Harcourt during January.
Rather than manually filtering and adding the numbers, SUMIFS can perform the calculation based on the relevant criteria.
This makes SUMIFS an important function for Advanced Excel for Data Analysis, especially in sales, finance and business reporting.
COUNTIFS for Advanced Excel Data Analysis
COUNTIFS allows users to count records that satisfy multiple conditions.
For example:
How many customers purchased a particular product?
Or:
How many transactions occurred in a particular location during a particular month?
These are typical questions that can be answered using Advanced Excel for Data Analysis techniques.
XLOOKUP for Advanced Excel Data Analysis
XLOOKUP can help retrieve information from a dataset based on a matching value.
For example, a company may have:
| Product ID | Product | Category | Price |
|---|---|---|---|
| P001 | Laptop | Computer | ₦450,000 |
| P002 | Monitor | Computer | ₦180,000 |
| P003 | Keyboard | Accessories | ₦35,000 |
If another spreadsheet contains only the Product ID, XLOOKUP can retrieve the corresponding product information.
This type of lookup becomes particularly useful when performing Advanced Excel for Data Analysis across multiple tables.
INDEX and MATCH for Advanced Excel Data Analysis
INDEX and MATCH are established Excel techniques for retrieving information from structured datasets.
Understanding lookup methods gives an Advanced Excel learner more flexibility when working with different spreadsheets and analytical situations.
The objective is not to memorise formulas.
The objective is to understand:
What information do I need?
Where is that information stored?
Which Excel function can retrieve it efficiently?
That mindset is central to Advanced Excel for Data Analysis.
Text Functions in Advanced Excel for Data Analysis
Data frequently contains text that needs to be cleaned or transformed.
Useful Excel functions include:
LEFTRIGHTMIDTRIMTEXTTEXTJOIN
For example, a customer code could contain several pieces of information that need to be separated for analysis.
Text functions can help prepare the dataset before applying other Advanced Excel for Data Analysis techniques.
Date Functions for Advanced Excel for Data Analysis
Dates are extremely important in data analysis.
Businesses often need to analyse:
- Daily performance
- Weekly performance
- Monthly performance
- Quarterly performance
- Yearly performance
Excel functions such as:
TODAYYEARMONTHDAYEOMONTHNETWORKDAYS
can help professionals organise and analyse date-related information.
This makes date functions another important component of Advanced Excel for Data Analysis.
Pivot Tables for Advanced Excel for Data Analysis
Pivot Tables are one of the most important tools in Advanced Excel for Data Analysis.
A Pivot Table summarises data by grouping information into categories and applying calculations such as sums, counts or averages. Microsoft describes Pivot Tables as tools for calculating, summarising and analysing data to reveal comparisons, patterns and trends.
Imagine a company has 20,000 sales transactions.
The dataset contains:
- Date
- Product
- Customer
- Salesperson
- Location
- Quantity
- Revenue
Reading all 20,000 rows manually would be inefficient.
A Pivot Table could quickly summarise:
- Revenue by product
- Revenue by location
- Revenue by salesperson
- Revenue by month
- Quantity sold by product
- Average sales per category
This is why Pivot Tables are so important in Advanced Excel for Data Analysis.How Pivot Tables Support Advanced Excel for Data Analysis
A Pivot Table allows the analyst to look at the same dataset from different perspectives.
For example:
View 1: Sales by Product
Which products generate the most revenue?
View 2: Sales by Location
Which locations perform best?
View 3: Sales by Month
Which months show the strongest performance?
View 4: Sales by Salesperson
Which salespeople generate the highest revenue?
View 5: Sales by Product and Location
Which products perform best in each location?
This flexibility makes Pivot Tables a core component of Advanced Excelfor Data Analysis.
Pivot Charts and Advanced Excel for Data Analysis
Pivot Charts extend the analytical capabilities of Pivot Tables by turning summaries into interactive visualisations.
Microsoft documents PivotCharts as a way to visually present and interact with filtered data.
For example, a sales Pivot Table can be connected to a chart showing:
- Monthly revenue
- Product performance
- Regional performance
- Salesperson performance
This helps transform Advanced Excel for Data Analysis from a spreadsheet exercise into a visual reporting process.
Excel Dashboards for Advanced Excel for Data Analysis
An Excel dashboard presents important information in a visual format.
A professional Advanced Excel for Data Analysis dashboard might contain:
- Total revenue
- Total transactions
- Average transaction value
- Top-performing products
- Monthly sales
- Sales by location
- Sales by salesperson
- Performance charts
- Interactive filters
Instead of forcing a manager to inspect thousands of spreadsheet rows, the dashboard highlights the information that matters most.
What Makes an Effective Excel Data Analysis Dashboard?
A good dashboard should answer questions quickly.
It should not simply contain numerous charts.
An effective Advanced Excel for Data Analysis dashboard should have:
Clear KPIs
Important performance indicators should be easy to identify.
Appropriate Visualisations
A chart should be selected because it communicates a particular type of information effectively.
Logical Structure
The dashboard should have a clear flow.
Useful Filters
Slicers and other filtering tools can help users examine specific categories of data. Microsoft documents slicers as one way to filter PivotTable data efficiently.
Professional Presentation
The dashboard should be clean, readable and understandable.
At Potenmunia Tech School, we teach the thinking behind the dashboard—not just how to format boxes and charts.
Advanced Excel for Data Analysis Example in Port Harcourt
Consider a fictional retail company operating in Port Harcourt.
The company has thousands of transactions containing:
- Product
- Customer
- Salesperson
- Location
- Date
- Quantity
- Revenue
Management wants to know:
Which products generate the most revenue?
Which months produce the strongest sales?
Which salespeople perform best?
Which locations generate the highest revenue?
An Advanced Excel for Data Analysis workflow could involve the following.
Step 1: Prepare the Dataset
Clean the data and ensure that each column contains consistent information.
Step 2: Use Advanced Excel Functions
Use functions such as SUMIFS, COUNTIFS, XLOOKUP, IF and date functions to create analytical fields and calculations.
Step 3: Build Pivot Tables
Create Pivot Tables showing sales by:
- Product
- Month
- Location
- Salesperson
Step 4: Create Charts
Convert important summaries into charts that make patterns easier to understand.
Step 5: Build an Excel Dashboard
Bring the most important KPIs and visualisations into a single dashboard.
Step 6: Interpret the Data
The final step is to explain what the results mean.
For example:
Product A generated the highest revenue during the first quarter, while Product B experienced stronger growth in the second quarter.
That conclusion is more valuable than simply producing a chart.
This is the difference between using Excel and practising Advanced Excel for Data Analysis.
Advanced Excel for Data Analysis and Business Decision-Making
Data analysis is valuable because it can support better decisions.
A business may use Advanced Excel for Data Analysis to understand:
Sales
Identify products and periods generating strong performance.
Finance
Analyse expenses and financial records.
Inventory
Monitor product quantities and movement.
Marketing
Evaluate campaign performance.
Human Resources
Analyse employee-related information.
Operations
Monitor operational performance.
Projects
Track project information, deadlines and budgets.
The application depends on the organisation and the type of data available.
Advanced Excel for Data Analysis in Nigeria
Across Nigeria, businesses and professionals work with information every day.
This includes businesses in:
- Port Harcourt
- Lagos
- Abuja
- Rivers State
- Other Nigerian cities and communities
Professionals may encounter spreadsheets containing sales information, financial data, inventory records, customer information, project data or operational reports.
For this reason, Advanced Excel for Data Analysis can be a practical workplace skill.
At Potenmunia Tech School in Port Harcourt, we believe technology training should connect classroom learning to real-world application.
Why Learn Advanced Excel for Data Analysis at Potenmunia Tech School?
At Potenmunia Tech School, we believe technology education should go beyond lectures, certificates and theoretical knowledge.
Our approach is based on practical capability.
We want learners to move from:
Learning
to
Practising
to
Building
to
Showcasing
to
Preparing for opportunities
This philosophy is central to how we approach Advanced Excel for Data Analysis.
100% Practical Advanced Excel for Data Analysis Training
Our learning philosophy emphasises practical application.
Instead of learning Excel functions only through definitions, learners should practise applying those functions to realistic datasets and problems.
With Advanced Excel for Data Analysis, this can include:
- Working with datasets
- Cleaning information
- Applying functions
- Creating Pivot Tables
- Building charts
- Developing dashboards
- Interpreting results
- Presenting findings
Real Project Experience in Advanced Excel for Data Analysis
Projects provide evidence of capability.
A learner might develop an:
- Excel sales dashboard
- Inventory analysis
- Expense analysis
- Customer analysis
- Employee report
- Business performance dashboard
These projects can help demonstrate practical understanding of Advanced Excel for Data Analysis.
Career Portfolio Building With Advanced Excel
Knowing Excel is one thing.
Being able to show what you can build is another.
A professional portfolio could include an Advanced Excel for Data Analysis project showing:
- The business problem
- The dataset
- The data-cleaning process
- The Excel functions used
- The Pivot Tables created
- The dashboard
- The insights discovered
- The recommendations based on the analysis
This gives employers or clients something tangible to evaluate.
Career and Income Readiness
Potenmunia Tech School focuses on helping learners understand how technology skills can connect with professional opportunities.
Advanced Excel for Data Analysis can complement roles involving:
- Administration
- Business operations
- Reporting
- Finance
- Sales
- Marketing
- Project coordination
- Data-related work
- Business support
We do not believe that completing an Excel course automatically guarantees employment or income.
Instead, our objective is to help learners build practical competence, confidence and evidence of capability.
AI Integration With Advanced Excel for Data Analysis
Artificial Intelligence is changing how professionals approach technology and productivity.
AI tools can assist with tasks such as:
- Explaining formulas
- Generating ideas
- Helping troubleshoot spreadsheet problems
- Supporting data-analysis workflows
- Improving productivity
However, AI should complement—not replace—understanding.
A learner who understands data structures, formulas, analytical reasoning and Excel fundamentals is better positioned to evaluate AI-generated suggestions.
This is why AI integration and future skills form part of Potenmunia Tech School’s broader learning philosophy.
One-on-One Mentorship
Learning Advanced Excel for Data Analysis can raise practical questions.
For example:
- Which Excel functions should I learn next?
- How can I improve my dashboard?
- Is my analysis correct?
- How can I present my project?
- How can I build a portfolio?
- What should I learn after Excel?
Where applicable, Potenmunia Tech School’s mentorship approach helps learners identify gaps, improve their skills and develop professional direction.
Advanced Excel for Data Analysis Is About Problem-Solving
A common misconception is that being advanced in Excel means knowing hundreds of formulas.
That is not the complete picture.
A strong Advanced Excel for Data Analysis learner should be able to think through a problem.
For example:
Problem: Sales have declined.
Question: When did the decline begin?
Analysis: Compare monthly sales.
Question: Which products contributed to the decline?
Analysis: Build a Pivot Table by product.
Question: Did the decline occur in every location?
Analysis: Analyse sales by location.
Question: How can management see the findings quickly?
Solution: Build an Excel dashboard.
This is what practical Advanced Excel for Data Analysis looks like.
Advanced Excel for Data Analysis: From Raw Data to Insight
A useful way to understand the complete process is:
Raw Data
↓
Data Cleaning
↓
Excel Functions
↓
Pivot Tables
↓
Analysis
↓
Charts
↓
Dashboard
↓
Insights
↓
Decision Support
This workflow shows why Advanced Excel for Data Analysis is more than spreadsheet formatting.
It is a structured approach to working with information.
Who Should Learn Advanced Excel for Data Analysis?
Advanced Excel for Data Analysis can be useful for:
- Students
- Graduates
- Entrepreneurs
- Business owners
- Administrative professionals
- Accountants
- Finance professionals
- Marketing professionals
- Project professionals
- Operations professionals
- HR professionals
- Freelancers
- Professionals developing digital skills
- People transitioning toward data-related work
You do not have to become a professional data analyst to benefit from Advanced Excel for Data Analysis.
Excel can be useful wherever professionals work with structured information.
What Can You Build With Advanced Excel for Data Analysis?
With practical Advanced Excel for Data Analysis skills, learners can build projects such as:
Sales Analysis Dashboard
Analyse revenue, products, locations and salespeople.
Inventory Analysis
Track stock movement and inventory levels.
Expense Dashboard
Analyse spending across categories and periods.
Employee Analysis
Organise and summarise employee-related information.
Project Tracker
Monitor project activities, deadlines and budgets.
Business Performance Dashboard
Bring important business metrics into a single analytical interface.
These projects can become portfolio evidence when they are properly documented.
Advanced Excel for Data Analysis at Potenmunia Tech School: What Makes Us Different?
Potenmunia Tech School is built around a simple principle:
We build competence, not just certificates.
Our difference is not simply that we teach technology.
Our difference is the way we approach technology education.
Practical Technology Training
Learn by doing.
Career and Income Readiness
Understand how skills can connect to professional opportunities.
Innovation and Entrepreneurship
Explore how technology can be used to create solutions, products and businesses.
AI and Future Skills Integration
Understand how AI can improve modern professional workflows.
Mentorship Ecosystem
Receive guidance while developing technical and professional capabilities.
Real-World Experience
Build projects based on practical problems.
Career Portfolio Building
Turn projects into evidence of what you can do.
Job-Readiness Support
Develop both technical and professional preparation.
Industry Alignment
Develop skills relevant to modern digital workplaces.
Long-Term Career Vision
Think beyond completing a course and consider where your skills can take you.
Advanced Excel for Data Analysis: Competence Over Certificates
A certificate can show that someone completed a training programme.
But a practical project can show what someone can actually do.
That distinction is central to Potenmunia Tech School.
Our goal is to help learners develop:
- Technical capability
- Practical experience
- Problem-solving ability
- Professional confidence
- Portfolio evidence
- Career awareness
This is why our approach to Advanced Excel for Data Analysis focuses heavily on practical application.
Frequently Asked Questions About Advanced Excel for Data Analysis
What is Advanced Excel for Data Analysis?
Advanced Excel for Data Analysis is the use of advanced Excel functions, formulas, Pivot Tables, charts, dashboards and data-management techniques to analyse information and generate useful insights.
Why is Advanced Excel important for data analysis?
Advanced Excel allows users to move beyond basic calculations and perform more structured analysis, including conditional calculations, lookups, data summarisation, visualisation and dashboard reporting.
What Excel functions are used for Advanced Excel for Data Analysis?
Commonly useful functions include IF, SUMIFS, COUNTIFS, XLOOKUP, INDEX, MATCH, text functions and date functions.
What is a Pivot Table in Advanced Excel for Data Analysis?
A Pivot Table is a tool for summarising and analysing datasets by categories. It can calculate values such as sums, counts and averages and can help reveal comparisons and trends.
What is an Excel dashboard?
An Excel dashboard is a visual report that combines important metrics, charts and filters to help users understand data and performance more quickly.
Can Excel be used for business data analysis?
Yes. Excel can be used for many business-analysis activities, including sales analysis, financial reporting, inventory analysis, customer analysis, project reporting and performance monitoring.
Is Advanced Excel the same as data analysis?
Not exactly. Advanced Excel is a set of tools and techniques. Data analysis is the broader process of examining information to answer questions and generate insights. Advanced Excel for Data Analysis combines Excel’s capabilities with analytical thinking.
Can I build a portfolio with Advanced Excel?
Yes. Practical projects such as dashboards, sales analyses, inventory reports and financial analyses can demonstrate how you apply Excel to real-world problems.
Can Advanced Excel help with career development?
Advanced Excel can support professional development by strengthening practical data, reporting and analytical skills. The career value depends on how the skills are applied alongside other qualifications and experience.
Why learn Advanced Excel for Data Analysis at Potenmunia Tech School?
Potenmunia Tech School focuses on practical technology education, real project experience, portfolio development, mentorship, career readiness and AI integration rather than certificates alone.
Is Potenmunia Tech School in Port Harcourt?
Potenmunia Tech School’s learning approach is positioned around practical technology education for learners in Port Harcourt and across Nigeria.
Learn Advanced Excel for Data Analysis With a Practical Mindset
Advanced Excel for Data Analysis is not simply about learning formulas.
It is about learning how to:
Organise data.
Clean data.
Analyse data.
Summarise data.
Visualise data.
Build dashboards.
Discover insights.
Communicate findings.
Support decisions.
At Potenmunia Tech School, we believe technology education should prepare learners for practical application.
That is why our approach combines Advanced Excel for Data Analysis, hands-on learning, real projects, portfolio development, mentorship, career readiness and AI awareness.
The objective is simple:
Learn the skill. Practise the skill. Build with the skill. Showcase the skill. Prepare for the opportunity.
Potenmunia Tech School
Building Competence, Not Just Certificates.
If you are looking to develop practical Advanced Excel for Data Analysis skills in Port Harcourt and Nigeria, Potenmunia Tech School provides an approach centred on learning by doing, building real projects and developing evidence of practical capability.
For general background on Microsoft Excel, see Wikipedia – Microsoft Excel.
For technical guidance on Pivot Tables and Excel data analysis, Microsoft’s documentation provides detailed information on Pivot Tables, PivotCharts, data models and related Excel analysis tools.
An AI Course in Port Harcourt 2026 is no longer just an additional skill; it has become a core career requirement for anyone who wants to remain relevant in the modern workforce of Rivers State. From large corporations in Trans-Amadi to growing startups in GRA, Peter Odili Road, and Eliozu, businesses are actively seeking individuals who can use artificial intelligence to work faster, smarter, and more profitably.
At Potenmunia Tech School, we created our AI Course in Port Harcourt 2026 to solve a specific problem: many people want to learn AI, but most available trainings are either too theoretical, too expensive, or not practical for the Port Harcourt job market. This detailed guide will walk you through everything you need to know before you enroll.
Table of Contents
- What Exactly is an AI Course in Port Harcourt 2026?
- Why Learning AI in Port Harcourt is Critical in 2026
- Who is This AI Course in Port Harcourt 2026 Really For? A Complete Breakdown
- What You Will Learn: A Detailed Curriculum Breakdown of Our AI Course in Port Harcourt 2026
- Tools and Platforms You Will Master – A Practical Guide
- Real Portfolio Projects You Will Build During Training
- Detailed Career Pathways After Completing Your AI Course in Port Harcourt 2026
- How to Choose the Right AI School in Port Harcourt – The Potenmunia Difference
- How to Enroll and What to Expect
- Conclusion and FAQs

What Exactly is an AI Course in Port Harcourt 2026?
Many people misunderstand what an AI Course entails. It is not about becoming a robotics engineer or building a humanoid robot from scratch.
According to Wikipedia, Artificial Intelligence is the intelligence demonstrated by machines, in contrast to the natural intelligence displayed by humans and animals. You can read the full academic definition here: https://en.wikipedia.org/wiki/Artificial_intelligence
In simple terms, an AI Course in Port Harcourt 2026 is a practical training program that teaches you how to instruct and manage intelligent software tools like ChatGPT, Claude, and Gemini to perform tasks that previously required hours of human effort. It is about learning how to automate content writing, automate market research, analyze large datasets in minutes, and build automated customer support systems for businesses. You are not building the AI; you are learning how to use it as a powerful employee for your career or business.
Why Learning AI in Port Harcourt is Critical in 2026
Understanding the economic context of Port Harcourt is crucial. This is not just a global trend; it is a local reality.
1. The Shift in Employer Expectations: In 2026, recruiters in Port Harcourt no longer ask “Do you know how to use a computer?” They ask “Can you use AI to improve your productivity?” A candidate with a certificate in AI has a proven advantage over a candidate with only a traditional degree.
2. The Rise of the Remote Economy: Skills learned in an AI Course in Port Harcourt 2026 are location-independent. This means you can live in Port Harcourt and work as a freelancer for a company in Lagos, London, or Texas. You are no longer limited to the jobs available only in Rivers State.
3. Business Survival for Entrepreneurs: For business owners, manual customer service and manual content creation are becoming too slow and expensive. AI allows a small business in Port Harcourt to respond to 100 WhatsApp inquiries in 5 minutes and generate a full month of social media content in one afternoon.
Who is This AI Course in Port Harcourt 2026 Really For? A Complete Breakdown
This program was intentionally designed for four categories of people:
For University Students and Recent Graduates: If you are studying at UniPort, Rivers State University, or Ignatius Ajuru, this course gives you a high-income skill before you even graduate. Instead of entering the job market with only a CV, you will enter with a CV plus a portfolio of real projects.
For Job Seekers and Serving Corps Members: The NYSC year is the perfect time to acquire a skill. Instead of waiting for a job, you will spend your service year learning how to become an AI-Powered Virtual Assistant or Business Automation Specialist – roles that companies are actively hiring for.
For Business Owners and Working Professionals: This training will teach you how to save at least 15 hours every week. You will learn how to automate your reports, automate your customer inquiries, and use AI to analyze your sales data to make better business decisions.
For Complete Beginners and Career Switchers: You do not need any prior knowledge of coding, programming, or data science. Our AI Course in Port Harcourt 2026 was built from the ground up for beginners. If you can use a smartphone and a laptop, you can learn AI.

What You Will Learn: A Detailed Curriculum Breakdown of Our AI Course in Port Harcourt 2026
Our curriculum is divided into three progressive levels to ensure you are not overwhelmed.
Level 1: Foundation and The Art of Prompt Engineering (Weeks 1-4)
This is the most important foundation. You will learn what generative AI is, how Large Language Models (LLMs) work, and the difference between tools like ChatGPT, Claude, and Gemini. The core skill here is Prompt Engineering – the art of writing precise, detailed instructions that force AI to give you accurate, high-quality, and non-generic results. We will teach you frameworks for writing prompts for writing, for analysis, and for problem-solving.
Level 2: Business Automation and Productivity Mastery (Weeks 5-10)
This is where we move from theory to real application. You will learn step-by-step how to:
- Automate content creation: How to create 30 days of social media content for any business in under 3 hours.
- Automate customer support: How to build an AI system that answers customer questions on WhatsApp and Instagram automatically.
- Automate research: How to use AI to research competitors, analyze market trends, and generate business reports in minutes instead of days.
- Automate data analysis: How to upload your sales data and use AI to identify your best-selling products and customer behavior.
Level 3: Portfolio Building and Job-Readiness (Weeks 11-16)
In this final phase of the AI Course in Port Harcourt 2026, we stop learning and start building. You will work on 3 to 5 real-world projects for real Port Harcourt businesses. We will then help you host these projects in a professional portfolio, rewrite your CV to highlight your new AI skills, and optimize your LinkedIn profile to attract both local and international recruiters.
Tools and Platforms You Will Master – A Practical Guide
You will not just watch videos about tools; you will use them daily. Our AI Course in Port Harcourt 2026 provides hands-on training on ChatGPT-4o for advanced reasoning, Claude 3.5 for professional writing, Google Gemini for research, Canva Magic Studio for AI-powered design, Notion AI for organizing your work, and Zapier and Make.com for connecting different apps and automating entire workflows without writing a single line of code.
Learn more about our practical learning philosophy here [Insert internal link to another Potenmunia blog post].
Real Portfolio Projects You Will Build
Theory without practice is useless. During this training, you will build: 1) An AI-Powered Content Calendar and Generator for a fashion or food business in Port Harcourt, 2) A fully automated WhatsApp and Instagram Customer Support Assistant, and 3) A Sales Performance Dashboard where you upload sales data and AI analyzes it for you.
These projects are tangible proof of your skills that you can show to any employer during an interview.
Career Pathways After an AI Course in Port Harcourt 2026
Graduates of this program do not just get a certificate; they qualify for specific high-demand roles such as AI-Powered Virtual Assistant for executives, Business Automation Specialist for SMEs, AI Content Strategist for marketing agencies, Prompt Engineer for tech companies, and Freelance AI Consultant on platforms like Upwork and Fiverr.
How to Choose the Right School for AI Course in Port Harcourt 2026 – The Potenmunia Difference
Many people make the mistake of choosing an AI training based only on price or a flashy certificate. In 2026, a certificate without competence is useless. Many trainings will give you pre-recorded videos and a PDF certificate and leave you to figure things out yourself.
At Potenmunia Tech School, we do not give you just videos. We give you competence, mentorship, and real career results. Our AI Course in Port Harcourt 2026 is built on six pillars that guarantee you actually learn and become job-ready:
1. 100% Practical Training, Not Just Theory
We believe you cannot learn AI by watching. You learn AI by doing. In our AI Course in Port Harcourt 2026, every single class is a hands-on workshop. You will be on your laptop, using ChatGPT, Claude, Canva AI, and Zapier live with your instructor. By the time you finish, you would have spent over 80% of your time building and practicing, not just listening.
2. Career and Income Focus From Day One
We are not teaching you AI for fun. We are teaching you how to make money and get a job with it. From your first week, we show you how this skill translates to real roles like AI Virtual Assistant, Automation Specialist, and Freelance Consultant. Every project you build is designed to be added directly to your portfolio to show employers.
3. Innovation Mindset Over Memorization
The AI tools of today will change tomorrow. That is why we do not teach you to memorize buttons. We teach you how to think like an innovator. We teach you how to analyze any business problem in Port Harcourt – whether it is a fashion store or a logistics company – and figure out how AI can solve it. This mindset keeps you relevant forever.
4. Future-Ready Curriculum That is Updated Monthly
Most schools are still teaching what was relevant in 2023. AI changes every month. Our curriculum for the AI Course in Port Harcourt 2026 is updated monthly to include the latest tools like Claude 3.5, GPT-4o, and new automation workflows. You will always learn what is working right now, not what worked last year.
5. Mentorship Ecosystem With Direct Access to Instructors
You are not left alone after class. You get direct access to your instructors via a dedicated mentorship community. If you are stuck on a project at 9pm, you can ask questions and get guidance. This support system is what helps our students actually finish and succeed, unlike other schools where students drop out because no one is there to guide them.
6. Real-World Project Experience, Not Dummy Projects
We do not give you fake assignments. In the final stage of your training, you will work on real business problems for real Port Harcourt businesses. You will build a working AI customer support assistant, a working content automation system, and a working data analysis dashboard. These are not class exercises; they are real solutions you can proudly show any employer.
This is why Potenmunia is different. We are not selling a certificate. We are building your competence and your career.
Conclusion
If you are ready to invest in a skill that will make you relevant for the next 10 years, enrolling for an AI Course in Port Harcourt 2026 at Potenmunia Tech School is the most practical step you can take. You will learn a skill, build a portfolio, and become truly job-ready.
FAQs
Do I need a laptop?
Yes, a laptop is required for practice, but we can guide you on affordable options if you do not have one.
Is the AI Course in Port Harcourt 2026 suitable for someone with no tech background?
Yes, absolutely. The program was designed specifically for complete beginners and we teach everything from scratch.

What Makes Potenmunia Tech School Different?
At Potenmunia Tech School, we believe technology education should go beyond lectures, certificates and theoretical knowledge. Our approach is designed to help learners learn practical skills, build real experience, develop professional confidence and become ready for opportunities in the digital economy.
Our Core Pillars
1. Practical Technology Training
Our training is designed around hands-on learning. Students don’t just listen to instructors—they practise the tools, techniques and workflows used in real-world technology environments.
2. Career & Income Readiness
We focus on helping learners understand how their skills can translate into employment, remote work, freelancing and other income-generating opportunities.
3. Innovation & Entrepreneurship
We encourage learners to think beyond getting a job. Students are exposed to ways technology and AI can be used to create solutions, businesses, products and new opportunities.
4. AI & Future Skills Integration
Artificial Intelligence is integrated into our learning approach to ensure students understand how modern AI tools can improve productivity, problem-solving, business processes and professional work.
5. Mentorship Ecosystem
Learning does not end with classroom instruction. Our mentorship approach provides guidance, direction and support as learners develop their technical and professional capabilities.
6. Real-World Experience
We place strong emphasis on practical projects and real-world applications. Students are encouraged to work on projects that demonstrate how their skills can solve actual problems.
What Makes the Potenmunia Learning Experience Different?
1. 100% Practical Learning
We emphasize learning by doing. Our students spend significant time applying what they learn rather than relying solely on theory.
2. One-on-One Mentorship
Where applicable, learners receive personalized guidance to help them identify gaps, improve their skills and make better career decisions.
3. Real Project Experience
Students work on practical projects that allow them to demonstrate their ability to apply technology to real-world problems.
4. Career Portfolio Building
We help learners understand how to turn their projects and skills into a professional portfolio that can demonstrate their capabilities to employers and clients.
5. Job-Readiness Support
Our approach goes beyond technical training. Learners are guided on how to position themselves for employment and professional opportunities.
6. AI Integration & Interview Preparation
We help learners understand how AI can be integrated into modern work while also developing the confidence and preparation required for professional interviews.
7. Industry Alignment
Our programmes are designed with the changing needs of the technology industry in mind, helping learners develop skills that are relevant to today’s digital workplace.
8. Long-Term Career Vision
We encourage learners to think beyond completing a course. The goal is to help them understand where their skills can take them over the next several years and develop a clear professional direction.
9. Professional Experience & Profile Development
We help learners build more than technical knowledge. Through projects, portfolios, mentorship and professional preparation, they can begin developing a stronger professional identity.
10. We Build Competence, Not Just Certificates
A certificate can show that someone completed a programme. Competence demonstrates what they can actually do. Our focus is therefore on developing practical capability, confidence and evidence of real work.
Our Promise to Every Learner
Learn the skill. Practise the skill. Build with the skill. Showcase the skill. Prepare for the opportunity.
If you are considering Data Analytics Training in Port Harcourt, choosing the right training school can make a major difference in how effectively you develop practical skills and prepare for opportunities in the digital economy.
Data analytics is no longer simply about learning how to arrange numbers in spreadsheets. Modern data analysts are expected to collect, clean, analyse, interpret and communicate data in ways that help organisations make better decisions. They may work with spreadsheets, databases, dashboards, visualisation tools, statistical techniques and increasingly, Artificial Intelligence.
That is why choosing a data analytics programme should involve more than asking, “How much does the course cost?” or “Will I receive a certificate?”
The more important question is:

Will this training help me develop the competence, practical experience, portfolio and professional confidence required to use data analytics in the real world?
At Potenmunia Tech School, our approach to technology education is built around that question.
Our philosophy is simple:
Learn the skill. Practise the skill. Build with the skill. Showcase the skill. Prepare for the opportunity.
This article explains what to look for before enrolling in Data Analytics Training in Port Harcourt and why Potenmunia Tech School takes a different approach to preparing learners for technology careers.
What Is Data Analytics?
Data analytics is the process of examining data to discover useful information, identify patterns, understand trends and support better decision-making.
In practical terms, a data analyst may take a collection of raw information, clean and organise it, analyse it, create visualisations and communicate the findings to people who need to make decisions.
For example, a business may want to know:
- Which products generate the most revenue?
- Which customers buy most frequently?
- Which marketing campaign performs best?
- Why did sales decrease in a particular month?
- Which locations are generating the highest demand?
- What trends can be identified from previous business data?
A trained data analyst can use data to help answer these questions.
This makes data analytics useful across industries including:
- Banking and finance
- Telecommunications
- Healthcare
- Education
- Retail
- Oil and gas
- Logistics
- Manufacturing
- Marketing
- E-commerce
- Government and public services
- Technology
For learners in Port Harcourt and across Nigeria, this creates an opportunity to develop a technology skill that can be applied across different industries.
Why Choosing the Right Data Analytics Training in Port Harcourt Matters
There are many ways to learn technology today.
You can watch free videos, read articles, take online courses, join communities or enrol in a physical training programme.
However, having access to information is not the same as developing competence.
One of the biggest challenges learners face is knowing what to learn, practising consistently, applying their knowledge to realistic problems and understanding how to present their abilities professionally.
A structured training environment can provide:
- A learning roadmap
- Instructor guidance
- Practical exercises
- Projects
- Mentorship
- Feedback
- Career direction
- Portfolio development
- Professional preparation
This is why selecting a Data Analytics Training in Port Harcourt programme should involve evaluating the entire learning experience rather than focusing only on the course title.
10 Things to Look for Before Enrolling in Data Analytics Training in Port Harcourt
1. Look for Practical, Hands-On Learning
One of the first questions to ask is:
How much practical work will I actually do?
Data analytics is a practical skill. Understanding concepts is important, but learners need opportunities to apply those concepts.
A strong programme should provide opportunities to work with data, solve problems, create analyses and interpret results.
At Potenmunia Tech School, we believe technology education should go beyond lectures.
Our approach emphasises learning by doing.
Students are encouraged to practise the tools, techniques and workflows they learn rather than simply memorising concepts for an examination.
The goal is to move from:
Learning → Practising → Applying → Building → Showcasing.
That difference matters because employers and clients ultimately need people who can demonstrate what they can do.
2. Check Whether the Training Includes Real Projects
A course can teach you the theory of data analytics without giving you enough experience applying it.
That is why prospective students should ask:
Will I work on practical projects?
Projects can help learners understand how individual skills fit together.
For example, instead of learning data cleaning, analysis and visualisation as isolated concepts, a learner can work through a project where they:
- Receive a dataset.
- Examine the information.
- Identify data-quality issues.
- Clean and organise the data.
- Analyse important patterns.
- Create visualisations.
- Interpret the findings.
- Present recommendations.
This type of experience provides evidence of practical capability.
At Potenmunia Tech School, Real Project Experience is one of our core pillars.
We encourage learners to work on practical projects that demonstrate how technology can be used to solve real-world problems.
3. Look Beyond the Certificate
A certificate can demonstrate that someone completed a programme.
But a certificate alone does not necessarily demonstrate what the person can do.
This is why Potenmunia Tech School focuses on a principle that guides our approach:
We Build Competence, Not Just Certificates.
Competence means being able to apply knowledge to a problem.
For a data analytics learner, that could mean being able to take raw information, prepare it, analyse it, create meaningful visualisations and communicate useful conclusions.
Before enrolling in a programme, therefore, ask:
- What practical skills will I have at the end?
- What projects will I complete?
- Can I demonstrate what I have learned?
- Will I develop a portfolio?
- Will I receive feedback?
- How will the training prepare me for professional opportunities?
These questions are often more important than simply asking whether the programme provides a certificate.
4. Evaluate the Tools and Technologies You Will Learn
A good data analytics programme should expose learners to tools and workflows relevant to modern data work.
Depending on the programme structure, learners may encounter technologies and concepts such as:
- Microsoft Excel
- SQL
- Data cleaning
- Data analysis
- Data visualisation
- Dashboards
- Statistical concepts
- Business intelligence
- Database concepts
- Reporting
- Artificial Intelligence
The exact tools are important, but the underlying ability to solve problems with data is even more important.
At Potenmunia Tech School, our training philosophy focuses on helping learners understand how technology can be applied to real-world problems, rather than simply collecting a list of software names.
5. Look for AI Integration
Artificial Intelligence is changing how professionals work with information, automate tasks and solve problems.
For aspiring data analysts, understanding how AI can complement analytical work is increasingly valuable.
AI can support areas such as:
- Productivity
- Data-related workflows
- Problem-solving
- Research
- Business processes
- Documentation
- Professional communication
- Learning and development
However, AI should complement foundational skills rather than replace them.
At Potenmunia Tech School, AI & Future Skills Integration is one of our core pillars.
We help learners understand how modern AI tools can improve productivity, problem-solving, business processes and professional work.
The objective is not simply to teach learners how to use AI tools.
It is to help them understand how to use technology intelligently to produce better outcomes.
6. Ask About Mentorship
Watching a lesson and completing an exercise does not always answer the questions that arise when you are trying to build a career.
You may need guidance about:
- What skill should I learn next?
- What areas do I need to improve?
- How should I structure my portfolio?
- What kind of projects should I build?
- How can I prepare for interviews?
- How can I position my skills professionally?
This is where mentorship can become valuable.
At Potenmunia Tech School, Mentorship Ecosystem is one of our core pillars.
Where applicable, learners receive personalised guidance to help identify gaps, improve their skills and make better career decisions.
Our goal is to ensure that learning does not stop when a classroom session ends.
7. Look for Career and Income Readiness
Learning data analytics should not be viewed only as an academic exercise.
Many learners are interested in technology because they want to create better professional opportunities.
Depending on their skills, experience and circumstances, data analytics can potentially support pathways such as:
- Employment
- Remote work
- Freelancing
- Contract work
- Business analysis
- Consulting
- Entrepreneurship
- Technology-enabled business opportunities
At Potenmunia Tech School, Career & Income Readiness is one of our core pillars.
We help learners understand how their technical abilities can potentially translate into professional opportunities.
We do not believe that completing a course automatically guarantees employment or income.
Instead, our objective is to help learners develop the skills, evidence, confidence and professional understanding required to pursue those opportunities more effectively.
8. Check Whether the Programme Helps You Build a Portfolio
A professional portfolio can help demonstrate practical ability.
For an aspiring data analyst, a portfolio might include projects demonstrating abilities such as:
- Data cleaning
- Data analysis
- Data visualisation
- Dashboard development
- Business insights
- Reporting
- Problem-solving
A portfolio can give employers, clients or collaborators something concrete to evaluate.
This is why Career Portfolio Building forms part of the Potenmunia learning experience.
We help learners understand how their projects and skills can be transformed into professional evidence of capability.
The objective is to move beyond saying:
“I know data analytics.”
towards being able to demonstrate:
“Here is what I have built, analysed and learned.”
9. Look for Interview and Job-Readiness Support
Technical ability is important, but professional opportunities often require more than technical knowledge.
Learners may need to understand how to:
- Present their skills
- Explain their projects
- Discuss problem-solving experiences
- Answer technical questions
- Communicate clearly
- Build professional confidence
- Prepare for interviews
At Potenmunia Tech School, Job-Readiness Support and Interview Preparation are part of our broader approach to career development.
We want learners to understand not only how to develop technical skills, but also how to communicate the value of those skills.
10. Consider the Long-Term Career Vision
One of the easiest mistakes to make when learning technology is focusing only on completing the next course.
A better question is:
Where can this skill take me over the next several years?
Data analytics can serve as a foundation for continued learning and professional development.
A learner may eventually explore areas such as:
- Business intelligence
- Advanced analytics
- Data science
- Artificial Intelligence
- Machine learning
- Business analysis
- Technology entrepreneurship
- Data-driven product development
At Potenmunia Tech School, we encourage learners to think beyond completing a programme.
Our Long-Term Career Vision approach helps learners consider where their skills can take them and how they can develop a clearer professional direction.
What Makes Potenmunia Tech School Different?
At Potenmunia Tech School, we believe technology education should go beyond lectures, certificates and theoretical knowledge.
Our approach is designed to help learners:
Learn practical skills.
Build real experience.
Develop professional confidence.
Prepare for opportunities in the digital economy.
Our difference is built around several core pillars.
Practical Technology Training
We design our training around hands-on learning.
Students do not simply listen to instructors. They practise tools, techniques and workflows that can be applied to real-world technology environments.
Our goal is to help learners move from passive learning to active competence.
Career & Income Readiness
Technology skills become more valuable when learners understand how those skills can be applied professionally.
We help learners understand potential pathways involving employment, remote work, freelancing and other technology-enabled opportunities.
The emphasis is on developing capability first and understanding how that capability can create opportunities.
Innovation & Entrepreneurship
Technology can do more than help someone secure a job.
It can also help people create solutions, products, services and businesses.
Our Innovation & Entrepreneurship pillar encourages learners to think creatively about how technology and AI can solve problems and create new opportunities.
AI & Future Skills Integration
The technology industry continues to evolve.
AI is becoming part of modern professional workflows, which is why learners need to understand how these technologies can support productivity and problem-solving.
Potenmunia integrates AI into its learning approach to help students develop future-oriented technology skills.
Mentorship Ecosystem
Learning does not end when a lesson finishes.
Where applicable, our mentorship approach gives learners personalised guidance as they develop technical and professional capabilities.
This can help learners identify gaps, make better decisions and maintain direction as they progress.
Real-World Experience
Theory provides a foundation.
Practice develops capability.
Real-world projects help learners understand how that capability can be applied.
At Potenmunia Tech School, we place strong emphasis on practical projects and real-world applications.
Students are encouraged to work on projects that demonstrate how technology can be used to solve actual problems.
What Makes the Potenmunia Learning Experience Different?
Our learning experience is designed around more than classroom instruction.
100% Practical Learning
We emphasise learning by doing.
Students spend significant time applying what they learn rather than relying solely on theory.
One-on-One Mentorship
Where applicable, learners receive personalised guidance designed to help them identify gaps, improve their skills and make better career decisions.
Real Project Experience
Students work on practical projects that allow them to demonstrate how technology can be applied to real-world problems.
Career Portfolio Building
We help learners understand how to turn their projects and technical capabilities into professional portfolio evidence.
Job-Readiness Support
Our approach goes beyond technical training.
Learners receive guidance on positioning themselves for employment and professional opportunities.
AI Integration & Interview Preparation
We help learners understand how AI can fit into modern professional workflows while developing the confidence and preparation needed for professional interviews.
Industry Alignment
Technology changes quickly.
Our programmes are designed with the changing needs of the technology industry in mind, helping learners develop skills relevant to today’s digital workplace.
Long-Term Career Vision
We encourage learners to think beyond completing a course.
The goal is to help them understand where their skills can take them over the next several years and develop a clearer professional direction.
Professional Experience & Profile Development
We help learners build more than technical knowledge.
Through projects, portfolios, mentorship and professional preparation, learners can begin developing a stronger professional identity.
Why Potenmunia Tech School for Data Analytics Training in Port Harcourt?
Choosing a technology school is ultimately about choosing a learning environment.
For learners searching for Data Analytics Training in Port Harcourt, Potenmunia Tech School provides an approach centred on practical competence, real-world experience, mentorship, AI integration and career preparation.
Rather than treating a certificate as the final destination, we view training as part of a longer journey.
That journey can be represented as:
Learn → Practise → Build → Showcase → Prepare → Grow.
This philosophy is at the heart of the Potenmunia learning experience.
Who Should Consider Data Analytics Training?
Data analytics can be suitable for different types of learners, depending on their interests and career goals.
You may consider data analytics if you are:
- A student interested in technology
- A graduate exploring digital career options
- A professional looking to develop a new skill
- An entrepreneur interested in data-driven decision-making
- A business owner who wants to understand business data
- Someone interested in remote technology opportunities
- A beginner looking for a structured technology learning path
- A professional interested in combining analytics with AI
You do not necessarily need to become a mathematician or computer scientist before beginning your learning journey.
What matters is having the willingness to learn, practise, solve problems and develop progressively.
What Questions Should You Ask Before Enrolling?
Before choosing any Data Analytics Training in Port Harcourt, ask the training provider:
About the curriculum
- What exactly will I learn?
- Which tools and technologies will I practise?
- Does the programme include AI and modern workflows?
About practical experience
- How many practical exercises will I complete?
- Will I work on real projects?
- Will I receive feedback on my work?
About career preparation
- Will I build a portfolio?
- Is interview preparation included?
- Is there mentorship?
- Will I learn how to present my skills professionally?
About the learning experience
- How much of the programme is practical?
- Who will guide me when I get stuck?
- What happens after the training?
- Is there a clear progression path?
These questions can help you distinguish between a programme that simply delivers lessons and one designed around developing practical competence.
Frequently Asked Questions About Data Analytics Training in Port Harcourt
What is Data Analytics Training?
Data analytics training teaches learners how to work with data to discover patterns, generate insights, create reports and support decision-making.
A practical programme can include data preparation, analysis, visualisation, reporting, projects and professional development.
Is Data Analytics a Good Skill to Learn in Port Harcourt?
Data analytics is a versatile digital skill because organisations across different industries use data to understand performance and make decisions.
For learners in Port Harcourt and elsewhere in Nigeria, developing data analytics skills can provide a foundation for exploring technology and data-related career opportunities.
Do I Need Previous Data Analytics Experience?
Not necessarily.
Beginners can start by learning the fundamentals and progressively developing their skills through guided practice.
The most important factors are willingness to learn, consistency and practical application.
Is a Certificate Enough to Become a Data Analyst?
A certificate can document course completion, but it does not by itself demonstrate practical competence.
That is why Potenmunia Tech School focuses on projects, practical learning, portfolio development, mentorship and professional preparation alongside formal training.
Will I Build Projects During Data Analytics Training?
Practical projects are an important part of the Potenmunia approach.
Projects give learners opportunities to apply what they learn and develop evidence of their ability to solve problems using technology.
Does Potenmunia Tech School Integrate AI Into Training?
Yes. AI and future skills form one of Potenmunia Tech School’s core learning pillars.
The aim is to help learners understand how modern AI tools can support productivity, problem-solving, business processes and professional work.
Does Potenmunia Tech School Provide Mentorship?
Where applicable, learners receive personalised guidance designed to help them identify skill gaps, improve their capabilities and make better career decisions.
Can Data Analytics Lead to Remote Work or Freelancing?
Data analytics skills can potentially be applied to employment, remote work, freelancing and other professional opportunities.
However, completing training does not guarantee a job or income. Building strong practical skills, developing a portfolio, gaining experience and learning how to position yourself professionally are important parts of becoming opportunity-ready.
Why Choose Potenmunia Tech School for Data Analytics Training in Port Harcourt?
Potenmunia Tech School differentiates its learning experience through practical technology training, real project experience, mentorship, portfolio building, AI integration, career preparation, innovation and long-term career development.
Our focus is not simply on helping learners complete a course.
Our focus is on helping learners develop competence they can demonstrate and build upon.
The Potenmunia Promise
At Potenmunia Tech School, we believe the best technology education should prepare learners for what comes after the classroom.
That means developing practical skills.
It means practising those skills repeatedly.
It means building projects that demonstrate competence.
It means creating a professional portfolio.
It means developing confidence.
It means understanding how AI is changing the workplace.
It means preparing for professional opportunities.
And it means thinking beyond the next certificate.
Our promise to every learner is:
Learn the skill. Practise the skill. Build with the skill. Showcase the skill. Prepare for the opportunity.
If you are searching for Data Analytics Training in Port Harcourt, look beyond the course title.
Look at the learning experience.
Look at the practical projects.
Look at mentorship.
Look at portfolio development.
Look at AI integration.
Look at career preparation.
Look at the long-term vision.
Because the real value of technology education is not simply what you know when the training ends.
It is what you can do with what you have learned.
And that is the standard Potenmunia Tech School is committed to building.
Potenmunia Tech School: Building Competence for the Digital Economy
For learners in Port Harcourt and across Nigeria who want to develop practical technology capabilities, Potenmunia Tech School provides a learning approach built around practical application, real-world experience, professional development, AI integration and long-term career growth.
Learn. Practise. Build. Showcase. Prepare. Grow.
Data Analytics Port Harcourt: Learn, Build Your Portfolio and Become Job Ready
Data Analytics Port Harcourt is now one of the most in demand skills for anyone who wants a profitable career in technology. Companies in Port Harcourt, Lagos and across the world are looking for people who can collect data, analyze it and turn it into clear business decisions.
If you want to learn data analytics in a way that goes beyond theory and actually makes you job ready, Potenmunia Tech School is the best place to start in Port Harcourt and Nigeria.
In this article, you will learn what data analytics is, why Port Harcourt is a great place to learn it, what you will build in your portfolio and how Potenmunia Tech School prepares you for real opportunities.
Table of Contents
- What is Data Analytics
- Why Learn Data Analytics in Port Harcourt
- Why Most Data Analytics Training Fails Students
- What Makes Potenmunia Tech School Different
- What You Will Learn in Data Analytics Port Harcourt Program
- Build Your Portfolio with Real Projects
- How We Make You Job Ready
- Who Should Enrol for Data Analytics Port Harcourt
- Career Opportunities After Training
- Frequently Asked Questions

1. What is Data Analytics?
Data analytics is the process of collecting, cleaning, analyzing and interpreting data to help businesses make smarter decisions.
In simple terms, data analytics answers questions like: What happened? Why did it happen? What will happen next? And what should the business do about it?
A data analyst uses tools like Excel, SQL, Power BI, Python and Tableau to turn raw data into reports, dashboards and insights that companies can use to increase sales, reduce cost and improve performance.
According to IBM’s guide to data analytics, data analytics is now core to how modern businesses operate.
2. Why Learn Data Analytics in Port Harcourt?
Port Harcourt is no longer just an oil and gas city. It is becoming a growing hub for technology, startups, remote work and digital entrepreneurship.
Businesses in Port Harcourt now need data analysts to understand customers, manage operations and compete online. Learning Data Analytics Port Harcourt gives you a local advantage because you understand the local market but you can also work remotely for companies in Lagos, UK, Canada and the US.
Instead of travelling far, you can get world class practical training right here in Port Harcourt at Potenmunia Tech School.
3. Why Most Data Analytics Training Fails Students
Many people complete a data analytics course but still cannot get a job. The reason is simple. Most trainings focus only on watching videos and getting a certificate.
They do not teach you how to:
- Work on real business problems
- Build a portfolio that employers can see
- Use AI tools to work faster and smarter
- Prepare for interviews and freelance clients
That is where Potenmunia Tech School is completely different.

4. What Makes Potenmunia Tech School Different for Data Analytics Port Harcourt?
At Potenmunia Tech School, we believe technology education should go beyond lectures, certificates and theoretical knowledge. Our approach is designed to help learners learn practical skills, build real experience, develop professional confidence and become ready for opportunities in the digital economy.
Here is what makes our Data Analytics Port Harcourt program the best choice:
Practical Technology Training
Our training is designed around hands on learning. You do not just listen to instructors. You practise the tools, techniques and workflows used in real world technology environments. You will clean real datasets, build dashboards and solve real business cases.
Career and Income Readiness
We focus on helping you understand how your data analytics skills can translate into employment, remote work, freelancing and other income generating opportunities. We do not just teach the skill, we show you how to earn with it.
Innovation and Entrepreneurship
We encourage you to think beyond getting a job. In our Data Analytics Port Harcourt classes, you are exposed to ways technology and AI can be used to create solutions, businesses, products and new opportunities.
AI and Future Skills Integration
Artificial Intelligence is integrated into our learning approach. You will learn how modern AI tools can improve your productivity, help you analyze data faster and enhance your business processes and professional work.
Mentorship Ecosystem
Learning does not end with classroom instruction. Our mentorship approach provides guidance, direction and support as you develop your technical and professional capabilities in data analytics.
Real World Experience
We place strong emphasis on practical projects and real world applications. You will work on projects that demonstrate how your skills can solve actual problems for businesses in Port Harcourt and beyond.
5. What You Will Learn in Data Analytics Port Harcourt Program
Our Data Analytics Port Harcourt curriculum is 100 percent practical and industry aligned.
Module 1: Foundation of Data Analytics
Understanding data types, data lifecycle and business problem framing.
Module 2: Microsoft Excel for Data Analysis
Advanced Excel formulas, pivot tables, data cleaning and visualization.
Module 3: SQL for Data Analysis
How to query databases, join tables and extract insights using SQL.
Module 4: Power BI and Tableau
Building professional dashboards and reports that business owners can understand.
Module 5: Python for Data Analytics
Using Python libraries like Pandas and NumPy for deeper analysis. You can learn more about why Python is essential for analytics from Google’s Data Analytics resources.
Module 6: AI Tools for Analysts
How to use AI to automate reporting, generate insights and improve productivity.
For beginners who want to understand the full learning path, you can check our internal guide: [Beginner’s Guide to Tech Careers in Port Harcourt] and [Potenmunia Tech School Data School Page]
6. Build Your Portfolio with Real Projects in Data Analytics Port Harcourt
At Potenmunia Tech School, we build competence not just certificates. A certificate can show that someone completed a program. Competence demonstrates what they can actually do.
That is why every student in our Data Analytics Port Harcourt program builds a career portfolio. You will:
- Work on 5 plus real business projects
- Build dashboards for sales, finance and marketing datasets
- Solve case studies from Port Harcourt businesses
- Publish your projects in a professional portfolio link you can share with employers on LinkedIn
Our promise is simple: Learn the skill. Practise the skill. Build with the skill. Showcase the skill. Prepare for the opportunity.
7. How We Make You Job Ready
Becoming job ready is more than knowing Excel or Power BI. Our job readiness support includes:
Career Portfolio Building
We help you turn your projects and skills into a professional portfolio that demonstrates your capabilities to employers and clients.
One on One Mentorship
Where applicable, you receive personalized guidance to help you identify gaps, improve your skills and make better career decisions.
AI Integration and Interview Preparation
We help you understand how AI is changing modern work while also developing the confidence and preparation required for professional interviews. We conduct mock interviews and CV reviews.
Long Term Career Vision
We encourage you to think beyond completing a course. We help you understand where your Data Analytics Port Harcourt skills can take you over the next several years and develop a clear professional direction.
8. Who Should Enrol for Data Analytics Port Harcourt?
This program is perfect for:
- Students and graduates who want a high income tech skill
- NYSC corps members in Port Harcourt looking to become employable
- Business owners who want to use data to grow their business
- Workers who want to switch to tech or get remote jobs
- Anyone who wants to start freelancing on Upwork and Fiverr with data skills
No prior coding knowledge is required. We teach you from beginner to advanced.
9. Career Opportunities After Data Analytics Port Harcourt Training
After completing your training at Potenmunia Tech School, you can work as:
- Data Analyst
- Business Intelligence Analyst
- Junior Data Scientist
- Reporting Analyst
- Freelance Data Analyst for international clients
Data analysts in Nigeria now earn between 150,000 to 500,000 monthly for entry level roles, with remote roles earning even higher.
10. Frequently Asked Questions About Data Analytics Port Harcourt
What is the duration of Data Analytics Port Harcourt training at Potenmunia?
Our program duration is designed to make you competent within 3 to 4 months of intensive practical training and mentorship.
Do I need a laptop to start?
Yes, having a laptop will help you practise faster, but we have a learning environment that supports you.
Will I get a certificate?
Yes, you will get a certificate of completion, but more importantly you will graduate with a portfolio of real projects and job readiness support.
Why is Potenmunia Tech School the best for Data Analytics Port Harcourt?
Because we focus on 100 percent practical learning, real project experience, one on one mentorship, career portfolio building and AI integration. We do not just teach. We make you competent and confident.
How do I register?
Visit Potenmunia Tech School in Port Harcourt or contact us directly to book your seat for the next Data Analytics Port Harcourt cohort. Slots are limited to ensure personalized mentorship.
Conclusion
If you have been searching for Data Analytics Port Harcourt training that truly delivers, your search ends here.
At Potenmunia Tech School, we are not just giving you lessons. We are giving you practical skills, real experience, a professional portfolio and a clear path to opportunities in the digital economy.
Are you ready to learn, build your portfolio and become job ready?
Enroll for Data Analytics Port Harcourt at Potenmunia Tech School today and start your journey to competence by clicking on this link https://www.potenmuniatechschool.com