

AI Business Automation Guide 2026
If you run a business in Port Harcourt, GRA, Peter Odili, Garrison, or Trans-Amadi, you are losing money every day you do manual repetitive work. Customers message you at 11pm asking “How much?” and you reply next morning – you have lost that sale. You spend 4 hours daily posting content, replying DMs, and sending invoices manually.
AI Business Automation solves this problem completely. It connects your WhatsApp, Instagram, Gmail, Excel, and website together so they work automatically without you touching them. While you sleep, your system replies to customers, sends payment links, follows up abandoned carts, and posts content.
This detailed professional guide will show you exactly what business automation means, how businesses in Port Harcourt use it to increase sales by 60%, and how you can build your own automated system in 12 weeks.
Table of Contents
- What is Business Automation and Why It Matters in Nigeria?
- Why Manual Businesses Are Dying in 2026
- 7 Core Areas You Can Automate in Your Business
- How to Build Automation: Tools and Workflows
- Real Examples from Port Harcourt Businesses
- How to Earn as Automation Specialist
- Why Potenmunia is Best Place to Learn – 6-Pillar Breakdown
- Conclusion and FAQs

1. What is AI Business Automation and Why It Matters?
What is AI Business Automation and Why It Matters? According to Wikipedia, business process automation is the use of technology to automate repetitive tasks and workflows to reduce costs and increase efficiency. Read more here: https://en.wikipedia.org/wiki/Business_process_automation
AI Business Automation means using artificial intelligence to handle your customer service, marketing, sales follow-up, and operations automatically. Example: A customer fills a Google Form on your website at 2am. Instantly, they get WhatsApp message with price list, your Excel sheet updates with their name, and an invoice is created – all without you waking up.
This is why smart business owners in Port Harcourt are adopting it. They save salary costs, never lose customers due to slow replies, and work 20 hours instead of 60 hours weekly.
2. Why Manual Businesses Are Dying and AI Business Automation is Taking Over
Why Manual Businesses Are Dying and AI Business Automation is Taking Over is simple – customers now expect instant replies.
In 2026, if you reply after 10 minutes, customer has already bought from competitor who replied in 2 seconds with automated system. Companies in Trans-Amadi and Onne now require automation skills for Operations roles because they know one automated system saves ₦120k monthly in extra staff salary.
AI Business Automation is critical because it solves 3 biggest problems for Nigerian businesses:
- Slow customer response – automation replies in 2 seconds 24/7
- High staff cost – one system does work of 3 staff
- Inconsistent marketing – automation posts content every day by 9am without fail
Businesses that refuse to adopt this will spend more and earn less. Businesses that adopt it will dominate.
3. 7 Core Areas You Can Automate with AI Business Automation
7 Core Areas You Can Automate with AI Business Automation:
1. Customer Service Automation
Build WhatsApp and Instagram DM system that replies “Price?” automatically with catalog, pictures, and payment link. This area alone makes AI Business Automation worth millions for retail businesses in Mile 1 and Diobu.
2. Sales Follow-Up Automation
Automatically follow up with customers who asked price but did not buy after 2 hours, after 24 hours, and after 3 days with persuasive messages and discounts. This recovers 40% of lost sales.
3. Content Marketing Automation
Automate 30 days of content creation in 2 hours. Type business name once, and system generates content ideas, captions, hashtags, and image prompts for Canva automatically.
4. Lead Management Automation
When lead comes from Facebook Ad, automatically add to Excel, send WhatsApp welcome message, assign to sales rep, and remind rep to call after 30 minutes. No lead is ever forgotten again.
5. Invoicing and Payment Automation
Automatically create invoice when customer says “I want to buy” on WhatsApp, send payment link, and send thank you message after payment with delivery details.
6. Review and Reputation Automation
Automatically send WhatsApp message 24 hours after delivery asking for Google review and referral. This builds reputation without you remembering to ask.
7. Reporting Automation
Automatically generate daily sales report, weekly performance report, and monthly profit report from your Excel and send to your email by 8am every Monday.

4. How to Build AI Business Automation: Tools and Workflows
How to Build AI Business Automation: Tools and Workflows requires 3 categories of tools:
Category 1: AI Brain – ChatGPT and Claude
This is the brain that writes your replies, content, and reports professionally.
Category 2: Connector Tools – Zapier and Make.com
These tools connect 5,000+ apps together. Example: Connect Instagram DM to WhatsApp to Excel to Gmail automatically. This is the engine of AI Business Automation.
Category 3: Business Apps – ManyChat, Canva AI, Durable AI
ManyChat automates WhatsApp and Instagram. Canva AI automates design. Durable AI builds website in 30 seconds.
Workflow Example for Fashion Brand in GRA:
Customer sends “How much is your bag?” on Instagram at 11pm -> ManyChat detects keyword “How much” -> Sends catalog with prices automatically -> Customer clicks “I want size M” -> Zapier creates invoice in Excel -> Sends Paystack payment link on WhatsApp -> After payment, sends thank you and delivery date -> Next day, sends follow-up “Did you receive?” and asks for review.
You built this once. It runs forever.
Learn more about full automation training here in our comprehensive guide on the Generative AI Course in Port Harcourt.
5. Real Examples from Port Harcourt Businesses Using AI Business Automation
A fashion brand in GRA used AI Business Automation to handle 200 customer inquiries daily without hiring extra staff. Sales increased by 60% because no customer waited more than 2 seconds for reply.
A logistics company in Trans-Amadi used AI Business Automation for daily reports and saved 15 hours weekly. The operations manager now focuses on getting more clients instead of typing reports.
A real estate company in Peter Odili used AI Business Automation for lead follow-up and closed 3 extra deals monthly worth ₦2 million commission because leads were followed up instantly after Facebook Ad.
These results are not magic. They are result of proper training and implementation of AI Business Automation.
6. How to Earn as AI Business Automation Specialist
After mastering AI Business Automation, you have 4 income paths:
Path 1: Get High-Paying Job – Oil and gas companies in Onne pay ₦300k – ₦500k for Operations Officers who can automate workflows.
Path 2: Freelance Specialist – Earn $30 – $60 per hour on Upwork helping foreign businesses automate customer support.
Path 3: Start Automation Agency – Businesses in Port Harcourt pay ₦100k – ₦300k monthly retainer for automation setup and maintenance.
Path 4: Boost Your Own Business – Automate your own business and save 20 hours weekly while increasing sales by 40%.
The demand for AI Business Automation specialists in Nigeria is growing 300% yearly because every business wants to save cost.

7. Why Potenmunia Tech School Stand Out As The Best Tech Training Center
Why Potenmunia is Best Place for AI Business Automation – 6-Pillar Breakdown:
1. 100% Practical Training
What we do: Every class, your laptop is open and you are building real automation for real business live. You build your first WhatsApp auto-reply on day one.
2. Career and Income Focus
What we do: We teach you how to earn from week one. How to get paying clients in Port Harcourt and abroad with AI Business Automation skills.
3. Innovation Mindset
What we do: We teach you how to think like problem solver. How to look at any business wasting 10 hours and build automation that does it in one hour.
4. Future-Ready Curriculum
What we do: Tools change monthly. Our curriculum for AI Business Automation is updated monthly with latest features like GPT-4o Actions and Make.com integrations.
5. Mentorship Ecosystem
What we do: Direct access to instructors in physical class and private WhatsApp group. You paste your workflow, we correct live until world-class.
6. Real-World Projects
What we do: You graduate with portfolio of 25+ automation projects for real businesses in Port Harcourt and professional certificate.
Conclusion
Final Thoughts on AI Business Automation: If you run a business in Port Harcourt in 2026 and you are still doing manual, repetitive work, you are working harder than you should. Automation is not a luxury, it is survival. It is the defining factor that separates businesses that scale from businesses that struggle and close.
Ready to automate your business operations and stay ahead of the competition? Get practical, hands-on mentorship at Potenmunia Tech School. Check out our full course breakdown today to launch your tech journey and get job-ready fast.
FAQs
Do I need technical knowledge for AI Business Automation?
No. This training is 100% beginner-friendly and no-code. If you can type on WhatsApp and use Gmail, you can master professional business automation in 12 weeks. We teach from scratch in simple English.
How long is the training?
Our complete program is 12 weeks including practical projects, portfolio building, and client-getting training. You also get 6 months mentorship support after graduation.
Will automation replace my staff?
No. It makes your staff more productive. Instead of 3 staff replying DMs manually, one staff manages automated system that replies 200 customers daily. You save cost and your staff focuses on closing sales, not typing same replies 200 times.

Pandas for Data Analysis is one of the most important skills for anyone learning Python, data analytics, business intelligence, data science, and modern technology.
If you have ever wondered how data analysts take thousands of rows of raw information and turn them into useful business insights, Pandas for Data Analysis is one of the technologies you need to understand.
Pandas is an open-source Python library designed for data manipulation and analysis. Its major data structures include the Series and DataFrame, which make it possible to work with structured and labeled data in a practical way.
At Potenmunia Tech School, we believe learning technology should go beyond memorizing definitions or collecting certificates.
Our philosophy is simple:
Learn the skill. Practise the skill. Build with the skill. Showcase the skill. Prepare for the opportunity.
That philosophy is particularly important when learning Pandas for Data Analysis, because the real value of Pandas comes from applying it to practical data problems.

What Is Pandas for Data Analysis?
Pandas for Data Analysis means using the Python Pandas library to collect, organize, clean, transform, explore and analyze data.
In simple terms, Pandas helps you work with data using Python.
The official Pandas project describes the library as an open-source tool providing high-performance data structures and data analysis tools for Python.
Simple definition of Pandas for Data Analysis
Pandas for Data Analysis is the practical use of Python’s Pandas library to manipulate, clean, examine and analyze structured data in order to discover useful information and support decision-making.
This makes Pandas for Data Analysis particularly useful for students, researchers, business professionals, developers, data analysts and aspiring data scientists.
Why Is Pandas for Data Analysis Important?
Modern organizations generate enormous amounts of information.
Businesses may have data about:
- Customers
- Products
- Sales
- Expenses
- Employees
- Marketing
- Inventory
- Transactions
- Websites
- Social media
- Operations
- Financial performance
Raw data, however, does not automatically become useful information.
Pandas for Data Analysis provides tools for transforming raw datasets into information that can be examined and interpreted.
For example, a business in Port Harcourt might have 50,000 sales records.
Instead of manually checking thousands of rows, an analyst could use Pandas to answer questions such as:
- Which product generated the most revenue?
- Which month produced the highest sales?
- Which location generated the most transactions?
- What is the average transaction value?
- Which products are underperforming?
- How many customers purchased more than once?
- What percentage of sales came from each product category?
This is where Pandas for Data Analysis becomes more than a programming topic.
It becomes a practical business skill.
What Is Pandas Used for in Data Analysis?
Pandas can be used for many stages of the data analysis process.
Some of the most common uses of Pandas for Data Analysis include:
1. Data Collection
Pandas can load data from sources such as CSV files, Excel files and databases.
2. Data Cleaning
Pandas can help identify and handle missing, duplicate or inconsistent information.
3. Data Transformation
Analysts can modify columns, create new variables and transform information into useful formats.
4. Data Exploration
Pandas makes it possible to inspect datasets and understand their structure.
5. Data Filtering
You can select records based on specific conditions.
6. Data Sorting
You can organize records according to numerical or categorical values.
7. Data Aggregation
You can calculate totals, averages, counts and other statistics.
8. Data Grouping
You can group records by products, locations, dates or other categories.
9. Data Merging
You can combine information from different datasets.
10. Time-Series Analysis
Pandas provides functionality for working with dates and time-based information.
Pandas for Data Analysis and Python
Pandas is not a separate programming language.
It is a Python library.
This means that when you learn Pandas for Data Analysis, you are learning how to use Python to perform practical data tasks.
A basic Pandas workflow begins with:
import pandas as pd
The pd abbreviation is commonly used when working with Pandas.
You can then create a DataFrame:
import pandas as pd
data = {
"Product": ["Laptop", "Phone", "Tablet"],
"Sales": [450000, 280000, 190000]
}
df = pd.DataFrame(data)
print(df)
This creates a simple table of information.
What Is a Pandas DataFrame?
A DataFrame is one of the most important concepts in Pandas for Data Analysis.
A DataFrame is a two-dimensional labeled data structure consisting of rows and columns.
You can think of it as being similar to a spreadsheet or database table.
For example:
| Product | Location | Sales |
|---|---|---|
| Laptop | GRA | ₦450,000 |
| Phone | Rumuola | ₦280,000 |
| Tablet | D-Line | ₦190,000 |
This type of structured information is exactly the kind of data that Pandas is designed to work with.
The official Pandas documentation identifies the DataFrame as one of its two primary data structures.
What Is a Pandas Series?
A Series is the other major data structure in Pandas.
A Series is a one-dimensional labeled collection of data.
For example:
import pandas as pd
sales = pd.Series([450000, 280000, 190000])
print(sales)
A DataFrame can contain multiple Series, with each column functioning as a labeled data series.
Understanding Series and DataFrames is fundamental to learning Pandas for Data Analysis.
How to Install Pandas
If Python is already installed, Pandas can typically be installed using:
pip install pandas
Then import it into your Python program:
import pandas as pd
Pandas is open-source and freely available. The official project currently provides documentation, installation instructions, API references and getting-started resources.
How to Load Data with Pandas
One of the first practical skills in Pandas for Data Analysis is learning how to bring data into Python.
Loading CSV Data
import pandas as pd
df = pd.read_csv("sales.csv")
print(df.head())
CSV files are extremely common in data analysis.
Loading Excel Data
df = pd.read_excel("sales.xlsx")
print(df.head())
Pandas also provides tools for working with SQL databases and other data formats.
How to Explore Data with Pandas
Before analyzing a dataset, you need to understand it.
Pandas provides several useful commands.
head()
df.head()
Shows the first records.
tail()
df.tail()
Shows the last records.
shape
df.shape
Shows the number of rows and columns.
columns
df.columns
Shows column names.
info()
df.info()
Provides information about columns and data types.
describe()
df.describe()
Provides statistical summaries for appropriate numerical data.
These commands form an important part of practical Pandas for Data Analysis.
Data Cleaning with Pandas
One of the biggest reasons people learn Pandas for Data Analysis is data cleaning.
Real-world data is often messy.
A dataset might contain:
- Missing values
- Duplicate records
- Incorrect spelling
- Incorrect data types
- Empty cells
- Invalid dates
- Unnecessary columns
- Inconsistent categories
An analyst needs to identify and address these problems before drawing conclusions.
Finding Missing Data with Pandas
You can check for missing values using:
df.isnull().sum()
This provides a count of missing values in each column.
Depending on the situation, you might remove missing records:
df.dropna()
Or fill missing values:
df.fillna(0)
The correct method depends on what the missing data represents.
This is an important lesson in Pandas for Data Analysis:
Never clean data blindly. Understand the meaning of the data before changing it.
Removing Duplicate Data with Pandas
Duplicate records can distort analysis.
You can identify duplicates with:
df.duplicated()
You can remove duplicate rows with:
df.drop_duplicates()
For example, if the same transaction appears twice, failing to identify it could cause the business to overestimate its sales.
Filtering Data with Pandas
Filtering is another fundamental skill in Pandas for Data Analysis.
Suppose you want to find transactions above ₦300,000:
high_sales = df[df["Sales"] > 300000]
print(high_sales)
You can also use multiple conditions:
result = df[
(df["Sales"] > 300000) &
(df["Location"] == "GRA")
]
This allows an analyst to ask increasingly specific questions of a dataset.
Sorting Data with Pandas
You can sort data using sort_values().
For example:
df.sort_values("Sales", ascending=False)
This places the highest sales values first.
Sorting can help answer questions such as:
- What are our largest transactions?
- Which products generate the most revenue?
- Who are our highest-value customers?
Grouping Data with Pandas
Grouping is one of the most powerful concepts in Pandas for Data Analysis.
Suppose your dataset contains products and sales.
You can calculate total sales by product:
df.groupby("Product")["Sales"].sum()
You can calculate average sales:
df.groupby("Product")["Sales"].mean()
You can also count records:
df.groupby("Product").size()
This type of analysis converts individual records into useful summaries.
Pandas for Data Analysis with Dates
Many business datasets contain dates.
Examples include:
- Sales dates
- Customer registration dates
- Payment dates
- Delivery dates
- Website visits
- Employee records
Pandas provides extensive time-series functionality, including date ranges, frequency conversion, rolling calculations and time-based transformations.
For example:
df["Date"] = pd.to_datetime(df["Date"])
Once dates are correctly represented, analysts can perform time-based analysis.
Pandas for Data Analysis with Multiple Datasets
Real organizations rarely keep every piece of information in one table.
You might have:
Customers
| Customer ID | Name |
|---|---|
| 101 | Ada |
| 102 | David |
and:
Sales
| Customer ID | Amount |
|---|---|
| 101 | ₦450,000 |
| 102 | ₦280,000 |
Pandas can combine these datasets.
combined = pd.merge(
customers,
sales,
on="Customer ID"
)
This is known as merging or joining data.
The ability to combine datasets is an important part of professional Pandas for Data Analysis.
Pandas for Data Analysis and Business Intelligence
Data analysis is not only about writing Python code.
The ultimate objective is to answer useful questions.
Imagine a Port Harcourt retail company wants to understand its performance.
The raw dataset may contain thousands of transactions.
Using Pandas for Data Analysis, the company could calculate:
Total Revenue
df["Sales"].sum()
Average Transaction
df["Sales"].mean()
Highest Transaction
df["Sales"].max()
Lowest Transaction
df["Sales"].min()
Sales by Product
df.groupby("Product")["Sales"].sum()
These calculations can provide information that management can use when making decisions.
A Practical Pandas for Data Analysis Project
At Potenmunia Tech School, we believe that learners should practise with realistic problems.
Consider a fictional Port Harcourt electronics business.
Its dataset contains:
- Product
- Customer
- Location
- Quantity
- Unit Price
- Sales Date
A learner could use Pandas for Data Analysis to answer:
1. What is total revenue?
total_revenue = df["Sales"].sum()
2. What product generated the most revenue?
product_revenue = df.groupby("Product")["Sales"].sum()
3. Which location produced the most sales?
location_sales = df.groupby("Location")["Sales"].sum()
4. What is the average transaction?
average_transaction = df["Sales"].mean()
5. Which transactions were above ₦500,000?
large_transactions = df[df["Sales"] > 500000]
This is what practical Pandas for Data Analysis looks like.
It is not just learning commands.
It is using commands to answer questions.
Pandas for Data Analysis in Port Harcourt and Nigeria
The demand for data-driven decision-making extends across many sectors in Nigeria.
Businesses in Port Harcourt can potentially use data analysis for:
- Retail
- Logistics
- Education
- Healthcare
- Finance
- Real estate
- E-commerce
- Marketing
- Manufacturing
- Professional services
- Technology
For example, a Port Harcourt business could analyze customer records to understand purchasing behaviour.
A logistics company could analyze delivery records.
A school could analyze student performance.
An e-commerce business could analyze product sales.
A marketing team could analyze campaign performance.
These are practical scenarios where Pandas for Data Analysis can become useful.
Pandas for Data Analysis vs Excel
Excel remains an important business and analytical tool.
Pandas does not necessarily replace Excel.
Instead, the two can complement each other.
Excel is excellent for:
- Manual spreadsheet work
- Quick calculations
- Small datasets
- Business reporting
- Spreadsheet-based collaboration
Pandas is particularly useful for:
- Repeatable data-processing workflows
- Programmatic analysis
- Larger analytical tasks
- Data transformation
- Automation
- Reproducible analysis
Modern analysts may use both depending on the problem.
Pandas for Data Analysis and Data Visualization
Pandas can be used alongside visualization tools such as:
- Matplotlib
- Seaborn
- Plotly
A typical workflow is:
Pandas → Clean Data → Analyze Data → Visualize Results → Communicate Insights
For example, Pandas might calculate monthly revenue while a visualization library displays the trend.
This is why learning Pandas for Data Analysis is often part of a broader data analytics learning pathway.
Pandas for Data Analysis and Artificial Intelligence
Artificial Intelligence has changed how many professionals interact with data.
AI tools can help with:
- Generating ideas
- Explaining code
- Debugging
- Exploring analytical approaches
- Automating repetitive tasks
- Supporting documentation
However, learners still need to understand the underlying data and analytical logic.
At Potenmunia Tech School, our approach integrates AI and future skills with practical technical learning.
The objective is not simply to use AI to produce code.
The objective is to understand what the code does, verify the result and use technology responsibly to solve problems.
Why Practical Projects Matter When Learning Pandas
Watching tutorials can introduce you to Pandas for Data Analysis.
Practice develops familiarity.
Projects develop competence.
A learner who has completed five realistic Pandas projects can demonstrate something much more valuable than someone who has simply watched five tutorials.
Possible portfolio projects include:
1. Nigerian Sales Analysis
Analyze sales data and identify revenue patterns.
2. Customer Behaviour Analysis
Explore customer purchasing frequency and transaction values.
3. Business Expense Analysis
Analyze expenses and identify major spending categories.
4. E-Commerce Data Analysis
Analyze products, orders and customer activity.
Project 5: Student Performance Analysis
Analyze academic results and identify performance trends.
These projects can become evidence of practical ability.
How Potenmunia Tech School Teaches Pandas for Data Analysis Differently
At Potenmunia Tech School, we believe technology education should go beyond lectures, certificates and theoretical knowledge.
Our approach is built around:
Practical Training + Real Projects + Mentorship + Career Readiness + AI + Portfolio Development
Practical Technology Training
Learners practise the tools and workflows used in real-world technology environments.
When studying Pandas for Data Analysis, students should not simply memorize groupby(), merge() or fillna().
They should understand when and why to use them.
Career & Income Readiness
We help learners understand how technology skills can translate into professional opportunities.
Pandas can become part of a broader skill set for data analysis, reporting, business intelligence and related technology roles.
Innovation & Entrepreneurship
Data can become the foundation for technology solutions and business ideas.
Learners are encouraged to think about how analytical skills can be applied to real problems.
AI & Future Skills Integration
AI is integrated into our broader learning philosophy so that learners understand how modern tools can support productivity and problem-solving.
Mentorship Ecosystem
Mentorship provides guidance beyond the classroom.
Learners can receive support as they develop technical capabilities, projects and professional direction.
Real-World Experience
We believe learners should work on projects that resemble actual problems.
That means Pandas for Data Analysis should be connected to realistic datasets and practical questions.
The Potenmunia Learning Experience
100% Practical Learning
Our emphasis is on learning by doing.
One-on-One Mentorship
Where applicable, learners receive personalized guidance.
Real Project Experience
Learners develop projects that demonstrate practical application.
Career Portfolio Building
Projects can become portfolio evidence.
Job-Readiness Support
Technical skills are combined with professional preparation.
AI Integration and Interview Preparation
Learners are exposed to modern AI-supported workflows and professional preparation.
Industry Alignment
Learning should remain connected to the evolving technology industry.
Long-Term Career Vision
We encourage learners to think beyond completing a single course.
Professional Profile Development
The objective is to help learners build not only technical knowledge but also evidence of what they can actually do.
We Build Competence, Not Just Certificates
A certificate can demonstrate that a learner completed a programme.
Competence demonstrates what the learner can actually do.
For example, someone who claims to understand Pandas for Data Analysis should ideally be able to:
- Import a dataset
- Create and understand DataFrames
- Inspect data
- Identify missing values
- Clean datasets
- Filter information
- Sort records
- Group data
- Calculate statistics
- Merge datasets
- Work with dates
- Produce meaningful analytical results
- Explain what the results mean
That is practical competence.
And practical competence is one of the principles at the heart of Potenmunia Tech School.
Pandas for Data Analysis Career Path
Learning Pandas for Data Analysis can be one component of a broader technology career pathway.
A learner might progress through:
↓
Pandas for Data Analysis
↓
↓
↓
Statistics
↓
↓
↓
Real-World Projects
↓
Portfolio
↓
Career Preparation
Depending on their interests, learners can continue toward areas such as data analytics, business intelligence, data science or other technology disciplines.
Common Mistakes When Learning Pandas for Data Analysis
1. Memorizing Code
Memorizing commands without understanding the problem limits your ability to analyze new datasets.
2. Avoiding Real Data
Real-world data is messy.
Learning to work with imperfect data is part of becoming a better analyst.
3. Ignoring Data Cleaning
Bad data can lead to misleading conclusions.
4. Building No Projects
Projects help turn theoretical knowledge into practical ability.
5. Focusing Only on Certificates
Certificates have value, but practical evidence of what you can do is also important.
6. Ignoring Communication
A data analyst needs to explain findings clearly.
Frequently Asked Questions About Pandas for Data Analysis
What is Pandas for Data Analysis?
Pandas for Data Analysis is the use of the Python Pandas library to clean, manipulate, explore, transform and analyze structured data.
Why is Pandas important for data analysis?
Pandas provides practical data structures and tools for working with tabular, labeled and time-series data.
Is Pandas difficult to learn?
Pandas can be approachable for beginners who already understand basic Python. The learning process becomes easier when concepts are connected to practical datasets and projects.
Is Pandas a programming language?
No. Pandas is a Python library.
What is a DataFrame in Pandas?
A DataFrame is a two-dimensional labeled data structure containing rows and columns.
What is a Series in Pandas?
A Series is a one-dimensional labeled data structure.
Can Pandas analyze Excel files?
Yes. Pandas provides tools for reading and writing Excel data.
Can Pandas analyze CSV files?
Yes. Reading CSV data is one of the common workflows in Pandas for Data Analysis.
Can Pandas clean data?
Yes. Pandas provides tools for handling missing data, duplicates, transformations and other common data-cleaning tasks.
Is Pandas useful for Nigerian businesses?
Yes. Any organization working with structured business data can potentially use Pandas for reporting, analysis and data-driven decision-making.
Can I learn Pandas for Data Analysis in Port Harcourt?
Yes. Potenmunia Tech School provides a practical technology learning environment in Port Harcourt, with an emphasis on hands-on learning, projects, mentorship, AI integration and career readiness.
Wikipedia and Pandas for Data Analysis
Wikipedia can be useful when researching the background and general history of Pandas.
The Wikipedia article “Pandas (software)” describes Pandas as an open-source Python library for data manipulation and analysis and provides additional historical information about the project.
However, for technical documentation, learners should prioritize the official Pandas documentation because it provides current information about the library, its APIs, guides and releases.
Recommended reference
Wikipedia:
Pandas (software) on Wikipedia
Official Pandas Documentation:
Pandas Documentation
This distinction is important for good SEO and educational credibility: Wikipedia can serve as a general reference, while the official Pandas documentation should be the primary technical source.
Why Choose Potenmunia Tech School for Pandas for Data Analysis?
If you are searching for practical technology education in Port Harcourt, the question should not only be:
“Where can I learn Pandas for Data Analysis?”
A better question is:
“Where can I learn Pandas for Data Analysis, practise it, build projects with it, develop a portfolio and prepare to apply the skill professionally?”
That is the difference we aim to provide at Potenmunia Tech School.
Our approach connects:
Learning
→ Practice
→ Projects
→ Mentorship
→ Portfolio
→ Professional Preparation
We believe technology education should produce people who can demonstrate what they know.
Conclusion on Pandas for Data Analysis
Pandas for Data Analysis is an essential topic for learners who want to develop practical Python-based data skills.
From DataFrames and Series to data cleaning, filtering, sorting, grouping, merging, statistical analysis and time-series operations, Pandas provides a powerful foundation for working with real-world data.
But learning Pandas should not stop at writing:
import pandas as pd
The real journey begins when you start asking:
What problem can I solve with this data?
What does the data tell me?
What decision can this analysis support?
How can I communicate the result?
How can I turn this project into evidence of my ability?
That is why our philosophy at Potenmunia Tech School goes beyond certificates.
We believe in:
Learn the skill.
Practise the skill.
Build with the skill.
Showcase the skill.
Prepare for the opportunity.
For learners in Port Harcourt and across Nigeria who want practical technology education, Potenmunia Tech School is focused on building competence through practical training, real-world projects, mentorship, AI integration, portfolio development and career readiness.
AI Automation Training in Port Harcourt
If you are searching for AI Automation Training that actually helps you automate repetitive work, save 20 hours weekly, and increase income in Port Harcourt, you are in the right place.
In 2026, companies in Trans-Amadi, Onne, GRA, and Peter Odili are no longer hiring people who do manual repetitive tasks. They are hiring people who have completed professional AI Automation Training and can build systems that do those tasks automatically while they focus on growth.
This detailed professional guide will show you exactly what automation means, why it is the most valuable skill in Nigeria today, what you will learn inside our training, and how you can use it to transform your work, business, and career.
Table of Contents
- What is Automation and Why Does It Matter?
- Why Automation Skills Are Critical in 2026
- What You Learn: 7 Detailed Modules
- 10 Workflows You Will Automate
- How Businesses in Port Harcourt Use Automation to Grow
- Career Opportunities After Training
- Why Potenmunia is Best Place
- Conclusion and FAQs

What is AI Automation Training and Why It Matters?
What is AI Automation Training and Why It Matters? According to Wikipedia, intelligent automation is the use of artificial intelligence to automate tasks and workflows that were previously done manually. Read more here: https://en.wikipedia.org/wiki/Intelligent_automation
AI Automation Training means learning how to connect tools like ChatGPT, WhatsApp, Gmail, Excel, and Instagram together so they work automatically without you touching them. Example: A customer sends “How much is your bag?” on Instagram DM at 11pm, and your automated system replies instantly with price, pictures, and payment link while you are sleeping.
This is no longer future. Businesses in Garrison and Mile 1 are already doing it to save salary costs and never lose customers again.
Why AI Automation Training is Critical for Everyone in Port Harcourt in 2026
Why AI Automation Training is Critical for Everyone in Port Harcourt in 2026 is simple – manual work is expensive and slow.
For students in Uniport and RSU, it means automating research, assignment formatting, and study timetables. You finish a 3-week project in 3 days.
For professionals in Trans-Amadi, it means automating weekly reports, Excel analysis, email replies, and meeting summaries. Companies now add “Automation Skills” as a requirement for Admin and Operations roles paying ₦250k – ₦400k.
For business owners in GRA and Eliozu, it means automating customer replies on WhatsApp, content posting on Instagram, invoice sending, and follow-up messages. One business owner in Peter Odili used automation to handle 200 customer inquiries daily without hiring extra staff, saving ₦120k monthly.
Businesses that fail to adopt this skill will spend more money hiring people for work that one system can do for free.
What You Learn in AI Automation Training: 7 Detailed Modules
What You Learn in AI Automation Training: 7 Detailed Modules at Potenmunia Tech School:
Module 1: Foundation of AI Automation Training – Professional Prompting
Foundation of AI Automation Training – Professional Prompting is where you master R-T-C-F-E formula. You learn how to give clear instructions with Role, Task, Context, Format, and Example so your results are world-class. This module alone makes you 10x better than 95% of people in Port Harcourt.
Module 2: AI Automation Training for Office and Work Productivity
AI Automation Training for Office and Work Productivity teaches you how to automate your entire office workflow. You learn how to automatically turn rough site data into professional reports for your MD, how to automate Excel formulas and charts, and how to build a system that summarizes your Zoom meetings and sends action points to your team without you typing.
Module 3: Business and Sales Automation
In this module of AI Automation Training, you learn how to automate your business. You build a WhatsApp system that replies to “Price?” automatically with catalog and payment link, a system that automatically follows up with customers who abandoned cart after 2 hours, and a system that posts content on Instagram and Facebook every day by 9am without you opening the apps.
Module 4: Content and Marketing Automation
You learn how to automate 30 days of content creation in 2 hours. You build a workflow where you type your business name once, and the system generates content ideas, captions, hashtags, image prompts for Canva, and even video scripts for TikTok automatically.
Module 5: No-Code Automation Tools – Zapier and Make
This is the heart of AI Automation Training. You learn Zapier and Make.com – tools that connect 5,000+ apps together. Example: When someone fills your Google Form, automatically send them WhatsApp message, add them to Excel sheet, and create invoice – all without you touching anything.
Module 6: Building Custom GPTs and AI Assistants
You learn how to build your own Custom GPT that acts as your business customer service rep, your personal assistant, or your content writer. No coding needed. You build it with instructions only and deploy it on your website and WhatsApp.
Module 7: Portfolio, Monetization, and Client Getting
You build 25+ automation projects for real Port Harcourt businesses and learn how to charge businesses ₦150k – ₦400k for automation setup. We show you how to find clients in GRA, Trans-Amadi, and on Upwork earning $30 – $60 per hour.

10 Workflows You Will Automate After Training
After completing AI Automation Training, you will be able to automate:
- Customer inquiry reply on WhatsApp and Instagram DM
- Content creation and posting for 30 days
- Weekly report generation for MD
- Excel data analysis and chart creation
- Meeting transcription and summary
- Invoice creation and payment reminders
- Lead capture from Facebook Ads to Excel to WhatsApp
- Email newsletter creation and sending
- Video creation from sales scripts
- And many more custom workflows for any business
How Businesses in Port Harcourt Use Automation to Grow
A fashion brand in GRA automated customer replies and increased sales by 60% because no customer waited more than 2 seconds for a reply, even at midnight.
A logistics company in Trans-Amadi automated daily reports and saved 15 hours weekly for the operations manager, who now focuses on getting more clients instead of typing reports.
A real estate company in Peter Odili automated follow-up messages for leads from Facebook Ads and closed 3 extra deals monthly worth ₦2 million in commission because leads were followed up instantly.
These results are not magic. They are the result of proper AI Automation Training.
Career Opportunities After Professional Training
After completing AI Automation Training, you have 4 income paths:
Path 1: Get High-Paying Job – Oil and gas companies now pay ₦300k – ₦500k for Operations Officers who can automate workflows.
Path 2: Freelance Automation Specialist – Earn $30 – $60 per hour on Upwork helping foreign businesses automate customer support and marketing.
Path 3: Start Automation Agency in Port Harcourt – Businesses in Mile 1, Diobu, and GRA pay monthly retainer of ₦100k – ₦300k for automation maintenance.
Path 4: Boost Your Own Business – Automate your own business and save 20 hours weekly while increasing sales.

Why Potenmunia Tech School is Best Place for AI Automation Training
1. 100% Practical, Zero Theory
What we do: Every class, your laptop is open and you are building real automation workflows live. You build your first WhatsApp auto-reply system on day one.
2. Career and Income Focus
What we do: We teach you how to earn from week one. How to get paying clients in Port Harcourt and abroad.
3. Innovation Mindset
What we do: We teach you how to think like a problem solver. How to look at any business wasting 10 hours and build automation that does it in one hour.
4. Future-Ready Curriculum
What we do: Tools change monthly. Our curriculum for AI Automation Training is updated monthly with latest features like GPT-4o Actions and Make.com new integrations.
5. Mentorship Ecosystem
What we do: Direct access to instructors in physical class and private WhatsApp group. You paste your workflow, we correct live until world-class.
6. Real-World Projects
What we do: You graduate with portfolio of 25+ automation projects for real businesses and a professional certificate that proves your skill.
Conclusion
Final Thoughts on AI Automation Training: This is the single most valuable digital skill in 2026 because every business is looking to save time and reduce operational costs. If you can build automated systems that accomplish both, you will remain highly sought-after in Port Harcourt, across Nigeria, and in the global remote job market. Investing in this training is the smartest decision you can make for your career, business, and long-term earning potential.
Ready to build systems that generate income? Gain practical, hands-on mentorship at Potenmunia Tech School. Check out our full course breakdown today to launch your tech journey and get job-ready fast.
Do I need technical knowledge for AI Automation Training?
No. This training is 100% beginner-friendly and no-code. If you can type on WhatsApp and use Gmail, you can master professional automation in 12 weeks. We teach from scratch in simple English with Port Harcourt business examples.
How long is AI Automation Training?
Our complete program is 12 weeks including practical projects, portfolio building, and client-getting training. You also get 6 months mentorship support after graduation.
Will I get certificate after training?
Yes. You receive professional certificate from Potenmunia Tech School plus portfolio of 25+ automation projects that proves your skill to employers and clients.
Advanced Excel for Data Analysis is one of the most practical technology skills professionals can develop for working with business information, reports, financial records, sales data, customer information and operational datasets.
Excel is widely recognised as a spreadsheet and data-analysis tool, offering functions, charts, Pivot Tables and other capabilities for organising and analysing information.
But learning Advanced Excel for Data Analysis is about much more than learning formulas.
It is about learning how to take raw data, organise it, analyse it, identify meaningful patterns, create professional reports and communicate insights that can support better decisions.
At Potenmunia Tech School in Port Harcourt, Nigeria, we approach Advanced Excel for Data Analysis from a practical perspective.
Our goal is not simply to teach learners Excel commands.
Our goal is to help learners:
Learn the skill. Practise the skill. Build with the skill. Showcase the skill. Prepare for the opportunity.

What Is Advanced Excel for Data Analysis?
Advanced Excel for Data Analysis is the use of advanced Excel formulas, functions, tables, Pivot Tables, charts, data-cleaning techniques, dashboards and data-modelling features to transform raw information into useful insights.
Basic Excel can help you:
- Enter information
- Format spreadsheets
- Perform simple calculations
- Create basic tables
- Prepare simple reports
Advanced Excel for Data Analysis goes further.
It helps you:
- Analyse large datasets
- Clean and organise data
- Use advanced formulas
- Perform conditional calculations
- Search and retrieve information
- Summarise datasets with Pivot Tables
- Compare business performance
- Identify trends
- Build interactive reports
- Create professional dashboards
- Present analytical findings
The real value of Advanced Excel for Data Analysis is therefore not the number of formulas you know.
It is your ability to use Excel to answer meaningful questions.
Why Advanced Excel for Data Analysis Is Important
Modern organisations generate enormous amounts of information.
A business may have data about:
- Customers
- Products
- Sales
- Revenue
- Expenses
- Employees
- Inventory
- Marketing
- Projects
- Operations
Raw data alone does not automatically provide useful information.
Someone needs to organise the data, analyse it and communicate what it means.
That is where Advanced Excel for Data Analysis becomes valuable.
With the right Excel skills, a professional can transform thousands of rows of information into a structured report that helps answer questions such as:
- Which product generated the highest revenue?
- Which month had the strongest sales?
- Which salesperson performed best?
- Which location generated the most revenue?
- Which products are underperforming?
- How are expenses changing?
- What percentage of total sales came from each category?
- What trends can be identified from historical information?
These are practical Advanced Excel for Data Analysis questions.
Advanced Excel for Data Analysis Starts With Clean Data
Before creating a dashboard or Pivot Table, the data must be properly organised.
This is one of the most important principles in Advanced Excel for Data Analysis.
Poor-quality data can produce poor-quality analysis.
For example, imagine a sales spreadsheet containing:
| Date | Product | Location | Salesperson | Revenue |
|---|---|---|---|---|
| 01/01/2026 | Laptop | Port Harcourt | John | ₦450,000 |
| 02/01/2026 | Monitor | Port Harcourt | Mary | ₦180,000 |
| 03/01/2026 | Laptop | PH | John | ₦450,000 |
Although the information looks simple, the different representations of Port Harcourt and PH could create problems when analysing the location field.
Effective Advanced Excel for Data Analysis therefore begins with:
- Consistent data
- Correct data types
- Proper column headings
- Removal of unnecessary blank rows
- Duplicate checking
- Correct date formatting
- Consistent naming
- Appropriate Excel Tables
Microsoft recommends clean, tabular data with column headers when creating Pivot Tables.
Advanced Excel Functions for Data Analysis
One of the biggest areas of Advanced Excel for Data Analysis is learning how to use functions to solve analytical problems.
You do not need to memorise every Excel function.
You need to understand which function is appropriate for the problem you are trying to solve.
IF Function for Advanced Excel Data Analysis
The IF function allows Excel to return different results depending on whether a condition is true or false.
For example, a business could classify sales performance into categories such as:
- High
- Medium
- Low
This allows raw numbers to become more meaningful categories.
That is an important part of Advanced Excel for Data Analysis because analysis often involves transforming numbers into information that people can understand.
SUMIFS for Advanced Excel Data Analysis
SUMIFS is particularly useful when you need to calculate totals based on multiple conditions.
Imagine a company has thousands of sales records.
You may want to calculate:
Total sales for laptops in Port Harcourt during January.
Rather than manually filtering and adding the numbers, SUMIFS can perform the calculation based on the relevant criteria.
This makes SUMIFS an important function for Advanced Excel for Data Analysis, especially in sales, finance and business reporting.
COUNTIFS for Advanced Excel Data Analysis
COUNTIFS allows users to count records that satisfy multiple conditions.
For example:
How many customers purchased a particular product?
Or:
How many transactions occurred in a particular location during a particular month?
These are typical questions that can be answered using Advanced Excel for Data Analysis techniques.
XLOOKUP for Advanced Excel Data Analysis
XLOOKUP can help retrieve information from a dataset based on a matching value.
For example, a company may have:
| Product ID | Product | Category | Price |
|---|---|---|---|
| P001 | Laptop | Computer | ₦450,000 |
| P002 | Monitor | Computer | ₦180,000 |
| P003 | Keyboard | Accessories | ₦35,000 |
If another spreadsheet contains only the Product ID, XLOOKUP can retrieve the corresponding product information.
This type of lookup becomes particularly useful when performing Advanced Excel for Data Analysis across multiple tables.
INDEX and MATCH for Advanced Excel Data Analysis
INDEX and MATCH are established Excel techniques for retrieving information from structured datasets.
Understanding lookup methods gives an Advanced Excel learner more flexibility when working with different spreadsheets and analytical situations.
The objective is not to memorise formulas.
The objective is to understand:
What information do I need?
Where is that information stored?
Which Excel function can retrieve it efficiently?
That mindset is central to Advanced Excel for Data Analysis.
Text Functions in Advanced Excel for Data Analysis
Data frequently contains text that needs to be cleaned or transformed.
Useful Excel functions include:
LEFTRIGHTMIDTRIMTEXTTEXTJOIN
For example, a customer code could contain several pieces of information that need to be separated for analysis.
Text functions can help prepare the dataset before applying other Advanced Excel for Data Analysis techniques.
Date Functions for Advanced Excel for Data Analysis
Dates are extremely important in data analysis.
Businesses often need to analyse:
- Daily performance
- Weekly performance
- Monthly performance
- Quarterly performance
- Yearly performance
Excel functions such as:
TODAYYEARMONTHDAYEOMONTHNETWORKDAYS
can help professionals organise and analyse date-related information.
This makes date functions another important component of Advanced Excel for Data Analysis.
Pivot Tables for Advanced Excel for Data Analysis
Pivot Tables are one of the most important tools in Advanced Excel for Data Analysis.
A Pivot Table summarises data by grouping information into categories and applying calculations such as sums, counts or averages. Microsoft describes Pivot Tables as tools for calculating, summarising and analysing data to reveal comparisons, patterns and trends.
Imagine a company has 20,000 sales transactions.
The dataset contains:
- Date
- Product
- Customer
- Salesperson
- Location
- Quantity
- Revenue
Reading all 20,000 rows manually would be inefficient.
A Pivot Table could quickly summarise:
- Revenue by product
- Revenue by location
- Revenue by salesperson
- Revenue by month
- Quantity sold by product
- Average sales per category
This is why Pivot Tables are so important in Advanced Excel for Data Analysis.How Pivot Tables Support Advanced Excel for Data Analysis
A Pivot Table allows the analyst to look at the same dataset from different perspectives.
For example:
View 1: Sales by Product
Which products generate the most revenue?
View 2: Sales by Location
Which locations perform best?
View 3: Sales by Month
Which months show the strongest performance?
View 4: Sales by Salesperson
Which salespeople generate the highest revenue?
View 5: Sales by Product and Location
Which products perform best in each location?
This flexibility makes Pivot Tables a core component of Advanced Excelfor Data Analysis.
Pivot Charts and Advanced Excel for Data Analysis
Pivot Charts extend the analytical capabilities of Pivot Tables by turning summaries into interactive visualisations.
Microsoft documents PivotCharts as a way to visually present and interact with filtered data.
For example, a sales Pivot Table can be connected to a chart showing:
- Monthly revenue
- Product performance
- Regional performance
- Salesperson performance
This helps transform Advanced Excel for Data Analysis from a spreadsheet exercise into a visual reporting process.
Excel Dashboards for Advanced Excel for Data Analysis
An Excel dashboard presents important information in a visual format.
A professional Advanced Excel for Data Analysis dashboard might contain:
- Total revenue
- Total transactions
- Average transaction value
- Top-performing products
- Monthly sales
- Sales by location
- Sales by salesperson
- Performance charts
- Interactive filters
Instead of forcing a manager to inspect thousands of spreadsheet rows, the dashboard highlights the information that matters most.
What Makes an Effective Excel Data Analysis Dashboard?
A good dashboard should answer questions quickly.
It should not simply contain numerous charts.
An effective Advanced Excel for Data Analysis dashboard should have:
Clear KPIs
Important performance indicators should be easy to identify.
Appropriate Visualisations
A chart should be selected because it communicates a particular type of information effectively.
Logical Structure
The dashboard should have a clear flow.
Useful Filters
Slicers and other filtering tools can help users examine specific categories of data. Microsoft documents slicers as one way to filter PivotTable data efficiently.
Professional Presentation
The dashboard should be clean, readable and understandable.
At Potenmunia Tech School, we teach the thinking behind the dashboard—not just how to format boxes and charts.
Advanced Excel for Data Analysis Example in Port Harcourt
Consider a fictional retail company operating in Port Harcourt.
The company has thousands of transactions containing:
- Product
- Customer
- Salesperson
- Location
- Date
- Quantity
- Revenue
Management wants to know:
Which products generate the most revenue?
Which months produce the strongest sales?
Which salespeople perform best?
Which locations generate the highest revenue?
An Advanced Excel for Data Analysis workflow could involve the following.
Step 1: Prepare the Dataset
Clean the data and ensure that each column contains consistent information.
Step 2: Use Advanced Excel Functions
Use functions such as SUMIFS, COUNTIFS, XLOOKUP, IF and date functions to create analytical fields and calculations.
Step 3: Build Pivot Tables
Create Pivot Tables showing sales by:
- Product
- Month
- Location
- Salesperson
Step 4: Create Charts
Convert important summaries into charts that make patterns easier to understand.
Step 5: Build an Excel Dashboard
Bring the most important KPIs and visualisations into a single dashboard.
Step 6: Interpret the Data
The final step is to explain what the results mean.
For example:
Product A generated the highest revenue during the first quarter, while Product B experienced stronger growth in the second quarter.
That conclusion is more valuable than simply producing a chart.
This is the difference between using Excel and practising Advanced Excel for Data Analysis.
Advanced Excel for Data Analysis and Business Decision-Making
Data analysis is valuable because it can support better decisions.
A business may use Advanced Excel for Data Analysis to understand:
Sales
Identify products and periods generating strong performance.
Finance
Analyse expenses and financial records.
Inventory
Monitor product quantities and movement.
Marketing
Evaluate campaign performance.
Human Resources
Analyse employee-related information.
Operations
Monitor operational performance.
Projects
Track project information, deadlines and budgets.
The application depends on the organisation and the type of data available.
Advanced Excel for Data Analysis in Nigeria
Across Nigeria, businesses and professionals work with information every day.
This includes businesses in:
- Port Harcourt
- Lagos
- Abuja
- Rivers State
- Other Nigerian cities and communities
Professionals may encounter spreadsheets containing sales information, financial data, inventory records, customer information, project data or operational reports.
For this reason, Advanced Excel for Data Analysis can be a practical workplace skill.
At Potenmunia Tech School in Port Harcourt, we believe technology training should connect classroom learning to real-world application.
Why Learn Advanced Excel for Data Analysis at Potenmunia Tech School?
At Potenmunia Tech School, we believe technology education should go beyond lectures, certificates and theoretical knowledge.
Our approach is based on practical capability.
We want learners to move from:
Learning
to
Practising
to
Building
to
Showcasing
to
Preparing for opportunities
This philosophy is central to how we approach Advanced Excel for Data Analysis.
100% Practical Advanced Excel for Data Analysis Training
Our learning philosophy emphasises practical application.
Instead of learning Excel functions only through definitions, learners should practise applying those functions to realistic datasets and problems.
With Advanced Excel for Data Analysis, this can include:
- Working with datasets
- Cleaning information
- Applying functions
- Creating Pivot Tables
- Building charts
- Developing dashboards
- Interpreting results
- Presenting findings
Real Project Experience in Advanced Excel for Data Analysis
Projects provide evidence of capability.
A learner might develop an:
- Excel sales dashboard
- Inventory analysis
- Expense analysis
- Customer analysis
- Employee report
- Business performance dashboard
These projects can help demonstrate practical understanding of Advanced Excel for Data Analysis.
Career Portfolio Building With Advanced Excel
Knowing Excel is one thing.
Being able to show what you can build is another.
A professional portfolio could include an Advanced Excel for Data Analysis project showing:
- The business problem
- The dataset
- The data-cleaning process
- The Excel functions used
- The Pivot Tables created
- The dashboard
- The insights discovered
- The recommendations based on the analysis
This gives employers or clients something tangible to evaluate.
Career and Income Readiness
Potenmunia Tech School focuses on helping learners understand how technology skills can connect with professional opportunities.
Advanced Excel for Data Analysis can complement roles involving:
- Administration
- Business operations
- Reporting
- Finance
- Sales
- Marketing
- Project coordination
- Data-related work
- Business support
We do not believe that completing an Excel course automatically guarantees employment or income.
Instead, our objective is to help learners build practical competence, confidence and evidence of capability.
AI Integration With Advanced Excel for Data Analysis
Artificial Intelligence is changing how professionals approach technology and productivity.
AI tools can assist with tasks such as:
- Explaining formulas
- Generating ideas
- Helping troubleshoot spreadsheet problems
- Supporting data-analysis workflows
- Improving productivity
However, AI should complement—not replace—understanding.
A learner who understands data structures, formulas, analytical reasoning and Excel fundamentals is better positioned to evaluate AI-generated suggestions.
This is why AI integration and future skills form part of Potenmunia Tech School’s broader learning philosophy.
One-on-One Mentorship
Learning Advanced Excel for Data Analysis can raise practical questions.
For example:
- Which Excel functions should I learn next?
- How can I improve my dashboard?
- Is my analysis correct?
- How can I present my project?
- How can I build a portfolio?
- What should I learn after Excel?
Where applicable, Potenmunia Tech School’s mentorship approach helps learners identify gaps, improve their skills and develop professional direction.
Advanced Excel for Data Analysis Is About Problem-Solving
A common misconception is that being advanced in Excel means knowing hundreds of formulas.
That is not the complete picture.
A strong Advanced Excel for Data Analysis learner should be able to think through a problem.
For example:
Problem: Sales have declined.
Question: When did the decline begin?
Analysis: Compare monthly sales.
Question: Which products contributed to the decline?
Analysis: Build a Pivot Table by product.
Question: Did the decline occur in every location?
Analysis: Analyse sales by location.
Question: How can management see the findings quickly?
Solution: Build an Excel dashboard.
This is what practical Advanced Excel for Data Analysis looks like.
Advanced Excel for Data Analysis: From Raw Data to Insight
A useful way to understand the complete process is:
Raw Data
↓
Data Cleaning
↓
Excel Functions
↓
Pivot Tables
↓
Analysis
↓
Charts
↓
Dashboard
↓
Insights
↓
Decision Support
This workflow shows why Advanced Excel for Data Analysis is more than spreadsheet formatting.
It is a structured approach to working with information.
Who Should Learn Advanced Excel for Data Analysis?
Advanced Excel for Data Analysis can be useful for:
- Students
- Graduates
- Entrepreneurs
- Business owners
- Administrative professionals
- Accountants
- Finance professionals
- Marketing professionals
- Project professionals
- Operations professionals
- HR professionals
- Freelancers
- Professionals developing digital skills
- People transitioning toward data-related work
You do not have to become a professional data analyst to benefit from Advanced Excel for Data Analysis.
Excel can be useful wherever professionals work with structured information.
What Can You Build With Advanced Excel for Data Analysis?
With practical Advanced Excel for Data Analysis skills, learners can build projects such as:
Sales Analysis Dashboard
Analyse revenue, products, locations and salespeople.
Inventory Analysis
Track stock movement and inventory levels.
Expense Dashboard
Analyse spending across categories and periods.
Employee Analysis
Organise and summarise employee-related information.
Project Tracker
Monitor project activities, deadlines and budgets.
Business Performance Dashboard
Bring important business metrics into a single analytical interface.
These projects can become portfolio evidence when they are properly documented.
Advanced Excel for Data Analysis at Potenmunia Tech School: What Makes Us Different?
Potenmunia Tech School is built around a simple principle:
We build competence, not just certificates.
Our difference is not simply that we teach technology.
Our difference is the way we approach technology education.
Practical Technology Training
Learn by doing.
Career and Income Readiness
Understand how skills can connect to professional opportunities.
Innovation and Entrepreneurship
Explore how technology can be used to create solutions, products and businesses.
AI and Future Skills Integration
Understand how AI can improve modern professional workflows.
Mentorship Ecosystem
Receive guidance while developing technical and professional capabilities.
Real-World Experience
Build projects based on practical problems.
Career Portfolio Building
Turn projects into evidence of what you can do.
Job-Readiness Support
Develop both technical and professional preparation.
Industry Alignment
Develop skills relevant to modern digital workplaces.
Long-Term Career Vision
Think beyond completing a course and consider where your skills can take you.
Advanced Excel for Data Analysis: Competence Over Certificates
A certificate can show that someone completed a training programme.
But a practical project can show what someone can actually do.
That distinction is central to Potenmunia Tech School.
Our goal is to help learners develop:
- Technical capability
- Practical experience
- Problem-solving ability
- Professional confidence
- Portfolio evidence
- Career awareness
This is why our approach to Advanced Excel for Data Analysis focuses heavily on practical application.
Frequently Asked Questions About Advanced Excel for Data Analysis
What is Advanced Excel for Data Analysis?
Advanced Excel for Data Analysis is the use of advanced Excel functions, formulas, Pivot Tables, charts, dashboards and data-management techniques to analyse information and generate useful insights.
Why is Advanced Excel important for data analysis?
Advanced Excel allows users to move beyond basic calculations and perform more structured analysis, including conditional calculations, lookups, data summarisation, visualisation and dashboard reporting.
What Excel functions are used for Advanced Excel for Data Analysis?
Commonly useful functions include IF, SUMIFS, COUNTIFS, XLOOKUP, INDEX, MATCH, text functions and date functions.
What is a Pivot Table in Advanced Excel for Data Analysis?
A Pivot Table is a tool for summarising and analysing datasets by categories. It can calculate values such as sums, counts and averages and can help reveal comparisons and trends.
What is an Excel dashboard?
An Excel dashboard is a visual report that combines important metrics, charts and filters to help users understand data and performance more quickly.
Can Excel be used for business data analysis?
Yes. Excel can be used for many business-analysis activities, including sales analysis, financial reporting, inventory analysis, customer analysis, project reporting and performance monitoring.
Is Advanced Excel the same as data analysis?
Not exactly. Advanced Excel is a set of tools and techniques. Data analysis is the broader process of examining information to answer questions and generate insights. Advanced Excel for Data Analysis combines Excel’s capabilities with analytical thinking.
Can I build a portfolio with Advanced Excel?
Yes. Practical projects such as dashboards, sales analyses, inventory reports and financial analyses can demonstrate how you apply Excel to real-world problems.
Can Advanced Excel help with career development?
Advanced Excel can support professional development by strengthening practical data, reporting and analytical skills. The career value depends on how the skills are applied alongside other qualifications and experience.
Why learn Advanced Excel for Data Analysis at Potenmunia Tech School?
Potenmunia Tech School focuses on practical technology education, real project experience, portfolio development, mentorship, career readiness and AI integration rather than certificates alone.
Is Potenmunia Tech School in Port Harcourt?
Potenmunia Tech School’s learning approach is positioned around practical technology education for learners in Port Harcourt and across Nigeria.
Learn Advanced Excel for Data Analysis With a Practical Mindset
Advanced Excel for Data Analysis is not simply about learning formulas.
It is about learning how to:
Organise data.
Clean data.
Analyse data.
Summarise data.
Visualise data.
Build dashboards.
Discover insights.
Communicate findings.
Support decisions.
At Potenmunia Tech School, we believe technology education should prepare learners for practical application.
That is why our approach combines Advanced Excel for Data Analysis, hands-on learning, real projects, portfolio development, mentorship, career readiness and AI awareness.
The objective is simple:
Learn the skill. Practise the skill. Build with the skill. Showcase the skill. Prepare for the opportunity.
Potenmunia Tech School
Building Competence, Not Just Certificates.
If you are looking to develop practical Advanced Excel for Data Analysis skills in Port Harcourt and Nigeria, Potenmunia Tech School provides an approach centred on learning by doing, building real projects and developing evidence of practical capability.
For general background on Microsoft Excel, see Wikipedia – Microsoft Excel.
For technical guidance on Pivot Tables and Excel data analysis, Microsoft’s documentation provides detailed information on Pivot Tables, PivotCharts, data models and related Excel analysis tools.
If you are looking for one of the most important technical skills to develop for a career in data analysis, SQL for Data Analysis should be high on your learning list.
SQL for Data Analysis gives you the ability to work with structured data, ask questions from databases, retrieve information, filter records, combine tables, calculate business metrics and discover useful patterns hidden inside large datasets.
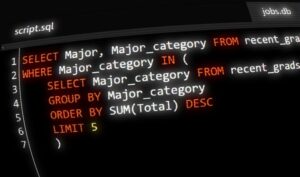
For beginners, SQL for Data Analysis may initially appear complicated. You may see commands such as SELECT, WHERE, GROUP BY, JOIN, CASE, CTE and window functions and wonder where to begin.
The good news is that SQL for Data Analysis can be learned progressively.
You do not need to master everything on your first day.
You need the right foundation, consistent practice, practical projects and an environment where you can move from learning SQL to actually using SQL to solve problems.
That is the philosophy behind Potenmunia Tech School.
At Potenmunia Tech School, we believe technology education should go beyond lectures, certificates and theoretical knowledge. Our approach focuses on practical skills, real-world experience, mentorship, career readiness, innovation, entrepreneurship and the integration of AI and future skills.
This complete guide explains SQL for Data Analysis, what SQL means, how SQL works, the most important SQL commands for data analysts, how beginners can practise SQL, what projects they can build and why practical SQL training matters for learners in Port Harcourt and across Nigeria.
What Is SQL for Data Analysis?
SQL for Data Analysis is the use of Structured Query Language (SQL) to retrieve, filter, transform, combine, summarise and analyse structured data stored in databases.
In simple terms:
SQL for Data Analysis allows you to ask questions about data and retrieve answers from a database.
For example, imagine a business has thousands of sales records.
Management may want to know:
- How much did we sell this month?
- Which product generated the highest revenue?
- Which customers buy most frequently?
- Which location generated the most sales?
- What is the average order value?
- Which products are performing poorly?
- How have sales changed over time?
Instead of manually examining thousands of records, an analyst can use SQL for Data Analysis to query the database.
This is one of the reasons SQL is so important in modern data work.
SQL is a domain-specific language used to manage data, particularly data stored in relational database management systems.
SQL for Data Analysis: Why Is SQL Important?
Data is everywhere.
Businesses collect information from:
- Websites
- Mobile applications
- Sales transactions
- Customer accounts
- Financial systems
- E-commerce platforms
- Logistics systems
- Educational platforms
- Healthcare systems
- Telecommunications
- Manufacturing
- Oil and gas operations
But collecting data is only the beginning.
The real value comes from understanding the data.
This is where SQL for Data Analysis becomes important.
SQL allows an analyst to transform raw database information into useful answers.
For example:
Raw data:
Thousands of individual sales transactions.
SQL for Data Analysis:
Calculate total revenue by month.
Business insight:
December generated the highest monthly revenue.
Business decision:
The company can investigate what caused the December increase and determine whether the strategy can be repeated.
This is the journey:
Data → SQL Analysis → Insight → Decision
SQL for Data Analysis Explained for Complete Beginners
If you are completely new to SQL, start with one simple idea:
A database stores information.
That information can be organised into tables.
A table contains:
- Rows
- Columns
For example, imagine a table called customers.
| customer_id | customer_name | city | age |
|---|---|---|---|
| 1 | Ada | Port Harcourt | 24 |
| 2 | David | Lagos | 29 |
| 3 | Grace | Abuja | 27 |
The columns describe the type of information.
The rows contain individual records.
With SQL for Data Analysis, you can ask questions about those records.
For example:
SELECT customer_name, city
FROM customers;
This tells the database:
Show me the customer names and cities.
That is the foundation of SQL for Data Analysis.
What Does SQL Stand For?
SQL stands for:
Structured Query Language.
It is commonly pronounced either “S-Q-L” or “sequel.”
SQL has been used for decades and has developed into a widely used language for working with relational data. Wikipedia’s SQL reference provides additional background on SQL’s history, structure and uses.
You can learn more about SQL through the relevant Wikipedia SQL reference:
Wikipedia: SQL — Structured Query Language
For learners, however, knowing the definition is only the beginning.
The important question is:
How do you actually use SQL for Data Analysis?
SQL for Data Analysis: The Most Important SQL Commands
A beginner learning SQL for Data Analysis should develop a strong understanding of the following concepts:
- SELECT
- FROM
- WHERE
- DISTINCT
- ORDER BY
- LIMIT
- COUNT
- SUM
- AVG
- MIN
- MAX
- GROUP BY
- HAVING
- JOIN
- CASE
- Subqueries
- CTEs
- Window functions
You do not need to learn all of these simultaneously.
A practical learning sequence is much easier.
1. SQL SELECT for Data Analysis
SELECT is one of the first commands you should learn when studying SQL for Data Analysis.
It tells SQL which columns you want to retrieve.
Example:
SELECT customer_name, city
FROM customers;
This query retrieves:
- Customer name
- City
from the customers table.
You can retrieve multiple columns:
SELECT customer_name, city, age, email
FROM customers;
You can also retrieve all columns:
SELECT *
FROM customers;
For beginners, this is an important concept:
SELECT tells SQL what information you want to see.
2. SQL WHERE for Data Analysis
One of the most important parts of SQL for Data Analysis is filtering data.
Imagine your database contains 100,000 customers.
You do not necessarily want to analyse all 100,000 customers at once.
You may want customers from Port Harcourt.
You can use WHERE.
SELECT customer_name, city
FROM customers
WHERE city = 'Port Harcourt';
Now SQL returns customers whose city is Port Harcourt.
You can also filter numerical information:
SELECT product_name, price
FROM products
WHERE price > 50000;
This asks:
Which products cost more than 50,000?
3. SQL ORDER BY for Data Analysis
When analysing data, you may want to sort your results.
For example:
SELECT product_name, price
FROM products
ORDER BY price DESC;
This sorts products from the highest price to the lowest.
You can also use:
ORDER BY price ASC;
This sorts from lowest to highest.
SQL for Data Analysis frequently involves sorting information to identify:
- Highest sales
- Lowest sales
- Highest-value customers
- Most expensive products
- Most recent transactions
- Oldest transactions
4. SQL COUNT for Data Analysis
COUNT() allows analysts to count records.
For example:
SELECT COUNT(*) AS total_customers
FROM customers;
This can answer:
How many customers are in our database?
You can also count specific values.
SELECT COUNT(customer_id) AS total_customers
FROM customers;
Counting is one of the most common tasks in SQL for Data Analysis.
5. SQL SUM for Data Analysis
SUM() allows you to calculate totals.
For example:
SELECT SUM(amount) AS total_sales
FROM orders;
This answers:
What is the total sales value?
Businesses can use this type of SQL for Data Analysis to calculate:
- Total revenue
- Total expenses
- Total orders
- Total quantities sold
- Total transactions
6. SQL AVG for Data Analysis
AVG() calculates an average.
For example:
SELECT AVG(amount) AS average_order_value
FROM orders;
This tells the analyst the average order value.
You can use averages to investigate:
- Average sales
- Average customer spending
- Average transaction size
- Average student performance
- Average delivery time
7. SQL MIN and MAX for Data Analysis
MIN() identifies the smallest value.
MAX() identifies the largest value.
Example:
SELECT
MIN(amount) AS smallest_order,
MAX(amount) AS largest_order
FROM orders;
This is useful when analysing ranges and extremes in datasets.
8. SQL GROUP BY for Data Analysis
GROUP BY is extremely important when learning SQL for Data Analysis.
It allows you to organise records into groups.
Suppose you want to know total sales by city.
SELECT
city,
SUM(amount) AS total_sales
FROM orders
GROUP BY city;
Now the database can provide a sales total for each city.
You can use GROUP BY for:
- Sales by city
- Revenue by product
- Customers by location
- Orders by month
- Employees by department
- Transactions by category
9. SQL HAVING for Data Analysis
HAVING allows you to filter grouped results.
For example:
SELECT
city,
SUM(amount) AS total_sales
FROM orders
GROUP BY city
HAVING SUM(amount) > 1000000;
This asks:
Which cities generated more than 1,000,000 in sales?
Understanding the difference between WHERE and HAVING is an important part of becoming comfortable with SQL for Data Analysis.
10. SQL JOIN for Data Analysis
If there is one concept beginners should take seriously when learning SQL for Data Analysis, it is JOIN.
Real-world databases often separate information into different tables.
For example:
Customers Table
| customer_id | customer_name |
|---|---|
| 1 | Ada |
| 2 | David |
Orders Table
| order_id | customer_id | amount |
|---|---|---|
| 101 | 1 | 50000 |
| 102 | 2 | 75000 |
The customer_id connects the tables.
A JOIN allows you to combine related information.
SELECT
customers.customer_name,
orders.amount
FROM customers
JOIN orders
ON customers.customer_id = orders.customer_id;
Now you can connect customer information with order information.
This is extremely valuable for SQL for Data Analysis.
Types of SQL JOINs for Data Analysis
Important JOIN types include:
INNER JOIN
Returns matching records from both tables.
LEFT JOIN
Returns records from the left table and matching records from the right table.
RIGHT JOIN
Returns records from the right table and matching records from the left table.
FULL OUTER JOIN
Returns matching and non-matching records from both sides where supported.
Understanding JOINs allows analysts to work with more realistic databases.
SQL CASE for Data Analysis
CASE allows you to create categories based on conditions.
Example:
SELECT
customer_name,
amount,
CASE
WHEN amount >= 100000 THEN 'High Value'
WHEN amount >= 50000 THEN 'Medium Value'
ELSE 'Low Value'
END AS customer_category
FROM orders;
Now you have created customer categories based on transaction values.
This is a powerful technique in SQL for Data Analysis.
You can use CASE for:
- Customer segmentation
- Performance classification
- Risk categories
- Sales categories
- Business rules
- Data transformation
SQL for Data Analysis Using Dates
Time-based analysis is extremely important.
Businesses frequently want to know:
- What happened this week?
- What happened this month?
- What happened last year?
- Which month performed best?
- Are sales increasing?
- Which day has the highest activity?
SQL provides date functions that can help analysts work with dates.
For example, depending on the database system, you may extract parts of dates such as:
- Year
- Month
- Day
This makes it possible to build time-based SQL for Data Analysis.
SQL for Data Analysis Using NULL Values
Real-world data is rarely perfect.
You may encounter:
- Missing values
- Blank fields
- Unknown information
- Incomplete records
SQL uses NULL to represent missing or unknown values.
Understanding NULL is important because incorrect handling of missing data can produce misleading analysis.
For example:
SELECT *
FROM customers
WHERE email IS NULL;
This can help identify customers without an email address.
Data quality is therefore an important part of SQL for Data Analysis.
SQL CTEs for Data Analysis
As SQL queries become more complex, Common Table Expressions, usually called CTEs, can make your analysis easier to organise.
Example:
WITH monthly_sales AS (
SELECT
month,
SUM(amount) AS total_sales
FROM orders
GROUP BY month
)
SELECT *
FROM monthly_sales;
CTEs can make complex SQL for Data Analysis workflows easier to read and maintain.
SQL Subqueries for Data Analysis
A subquery is a query inside another query.
For example:
SELECT product_name, price
FROM products
WHERE price > (
SELECT AVG(price)
FROM products
);
This asks:
Which products have prices above the average product price?
This type of thinking is important when moving from beginner SQL to more advanced SQL for Data Analysis.
SQL Window Functions for Data Analysis
Window functions are another important topic for analysts who want to move beyond basic SQL.
For example:
SELECT
customer_name,
amount,
RANK() OVER (ORDER BY amount DESC) AS sales_rank
FROM orders;
This can rank records based on sales amount.
Common window functions include:
- ROW_NUMBER()
- RANK()
- DENSE_RANK()
- LAG()
- LEAD()
- SUM() OVER()
Window functions can be particularly useful for advanced SQL for Data Analysis, including rankings, comparisons and running calculations.
SQL for Data Analysis: Real-World Example
Imagine a fictional retail business operating in Port Harcourt.
The company has a database containing:
- Customers
- Products
- Orders
- Payments
- Locations
Management asks:
Which product categories generated the most revenue during the year?
An analyst could use SQL to:
- Retrieve order data.
- Connect orders with products.
- Group transactions by product category.
- Calculate total revenue.
- Sort categories from highest to lowest.
- Present the results to management.
This is SQL for Data Analysis in practice.
The analyst is not writing SQL simply because SQL is interesting.
The analyst is using SQL to answer a business question.
SQL for Data Analysis in Port Harcourt
Port Harcourt is an important business and technology environment in Nigeria.
Organisations operating in Port Harcourt and across Nigeria can generate large amounts of structured data through:
- Retail
- Banking
- Fintech
- Logistics
- Education
- Healthcare
- Telecommunications
- Hospitality
- Manufacturing
- Oil and gas
- E-commerce
- Professional services
This creates opportunities for people who understand how to work with data.
For example, a Port Harcourt logistics company could use SQL for Data Analysis to examine delivery records.
A retailer could use SQL for Data Analysis to understand customer purchasing patterns.
An educational organisation could use SQL for Data Analysis to examine student performance.
A financial organisation could use SQL for Data Analysis to examine transaction information.
The technology may be the same.
The business questions are what change.
SQL for Data Analysis in Nigeria
The demand for digital skills continues to influence how businesses operate.
As organisations become more data-driven, professionals who can work with structured information can contribute to reporting, analysis and decision-making.
However, learning SQL for Data Analysis should not be approached as simply learning commands.
A learner should develop the ability to:
Understand the problem → Find the data → Query the data → Analyse the results → Explain the insight → Recommend an action
That is a much more powerful skill than memorising SQL syntax.
Can Beginners Learn SQL for Data Analysis?
Yes.
SQL for Data Analysis is suitable for beginners when taught progressively.
You can begin with:
SELECT
FROM
WHERE
ORDER BY
Then move into:
COUNT()
SUM()
AVG()
GROUP BY
HAVING
Then:
JOIN
CASE
And eventually:
CTE
Subqueries
Window Functions
The important thing is not to rush.
Build one skill on top of another.
Do You Need Programming Experience to Learn SQL for Data Analysis?
No.
You can start learning SQL for Data Analysis without being an experienced programmer.
SQL has its own syntax and way of thinking.
What matters most is your willingness to:
- Learn
- Practise
- Make mistakes
- Correct mistakes
- Ask questions
- Work with data
- Solve problems
Do You Need Advanced Mathematics for SQL for Data Analysis?
No.
You do not need advanced mathematics to begin learning SQL for Data Analysis.
However, as you progress into professional data analysis, understanding basic statistics and mathematical concepts such as:
- Percentages
- Averages
- Ratios
- Trends
- Distributions
- Rates
can become useful.
The more important beginner skill is analytical thinking.
SQL for Data Analysis Is More Than Writing Queries
This is one of the most important lessons for anyone learning SQL for Data Analysis.
Knowing how to write:
SELECT *
FROM customers;
does not automatically make someone a data analyst.
A data analyst needs to understand:
Why am I querying this data?
What question am I trying to answer?
Is the data reliable?
What does the result mean?
What action could the business take?
That is why practical education matters.
How to Practise SQL for Data Analysis
One of the best ways to improve your SQL for Data Analysis skills is to practise with problems instead of only watching tutorials.
For example, create a fictional sales database and ask:
Beginner Question
How many customers are there?
Intermediate Question
Which city has the highest number of customers?
Advanced Question
Which city generated the highest average customer spending?
More Advanced Question
Which customers have purchased more than the average customer?
Every question forces you to think.
That is how SQL becomes a practical analytical skill.
SQL for Data Analysis Projects for Beginners
If you want to demonstrate your skills, projects are extremely valuable.
Here are some project ideas.
1. Retail Sales Analysis
Use SQL to analyse:
- Orders
- Products
- Customers
- Revenue
- Locations
Questions could include:
- What are total sales?
- Which product sells most?
- Which location performs best?
- Who are the highest-value customers?
2. Customer Analysis
Analyse customer behaviour.
You could investigate:
- Purchase frequency
- Customer spending
- Repeat purchases
- Customer segments
3. Logistics Data Analysis
Analyse:
- Deliveries
- Locations
- Delivery times
- Order volume
- Delivery performance
4. Student Performance Analysis
Analyse:
- Students
- Subjects
- Scores
- Attendance
- Classes
5. Nigerian Business Sales Analysis
Create a fictional Nigerian business dataset containing:
- Customer locations
- Products
- Sales
- Transaction dates
- Revenue
Then use SQL for Data Analysis to investigate business performance.
What Tools Work With SQL for Data Analysis?
SQL is often part of a larger data-analysis workflow.
A data analyst may eventually work with:
- SQL
- Excel
- Power BI
- Tableau
- Python
- Databases
- Cloud data platforms
- AI tools
The exact tools vary by role and organisation.
The important thing is to understand that SQL for Data Analysis is one major part of a broader data-analysis skill set.
SQL for Data Analysis and Artificial Intelligence
Artificial Intelligence is changing the way many professionals work.
AI tools can assist with:
- Generating SQL ideas
- Explaining SQL queries
- Identifying potential errors
- Suggesting query improvements
- Helping beginners understand syntax
But AI should not replace fundamental understanding.
If an AI tool generates an incorrect SQL query, an analyst needs enough SQL knowledge to recognise the problem.
That is why learning SQL for Data Analysis remains valuable even in an AI-assisted workplace.
At Potenmunia Tech School, AI and future skills are integrated into our broader approach to technology education.
Our goal is not simply to teach learners how to use AI.
Our goal is to help learners understand how AI can improve their productivity while they continue developing genuine technical competence.
Why Learn SQL for Data Analysis at Potenmunia Tech School?
At Potenmunia Tech School, we believe technology education should go beyond lectures, certificates and theoretical knowledge.
Our approach is based on practical development.
We want learners to:
Learn the skill.
Practise the skill.
Build with the skill.
Showcase the skill.
Prepare for the opportunity.
That philosophy makes our approach to SQL for Data Analysis different.
What Makes Potenmunia Tech School Different?
Practical Technology Training
Our training emphasises hands-on learning.
Students should not simply listen to explanations about SQL.
They should practise SQL.
They should write SQL queries.
They should work with datasets.
They should make mistakes.
They should fix those mistakes.
They should solve analytical problems.
That is practical SQL for Data Analysis.
Career and Income Readiness
Learning SQL for Data Analysis is more meaningful when learners understand how technical skills can connect to professional opportunities.
Our approach helps learners understand how technology skills may contribute to:
- Employment
- Remote work
- Freelancing
- Professional projects
- Business opportunities
The goal is to help learners see the connection between:
Skill → Capability → Evidence → Opportunity
Innovation and Entrepreneurship
At Potenmunia Tech School, we encourage learners to think beyond getting a certificate.
We encourage questions such as:
What can I build?
What problem can I solve?
What business process can I improve?
What useful product can I create?
How can data help a business make better decisions?
This mindset turns SQL for Data Analysis from a classroom topic into a potential problem-solving tool.
AI and Future Skills Integration
AI is becoming part of modern professional workflows.
Our learning approach therefore incorporates AI and future skills alongside technical development.
For someone learning SQL for Data Analysis, AI can become an assistant for:
- Research
- Query explanation
- Debugging
- Documentation
- Productivity
- Learning support
But the learner remains responsible for understanding and validating the work.
Mentorship Ecosystem
Learning SQL can sometimes become frustrating.
A query may not work.
A JOIN may return unexpected results.
A calculation may be wrong.
A dataset may contain unexpected values.
Mentorship can help learners understand where they are struggling and how to improve.
At Potenmunia Tech School, learning does not have to end when the lesson ends.
Real-World Experience
One of the strongest ways to demonstrate SQL for Data Analysis skills is through projects.
A learner who says:
“I know SQL.”
has made a statement.
A learner who can say:
“I used SQL to analyse a sales dataset, identify the highest-performing product categories and present recommendations.”
has evidence.
That is why real-world project experience matters.
Career Portfolio Building
Your SQL journey should eventually produce evidence of your ability.
A strong project portfolio can include:
- Project title
- Business problem
- Dataset description
- SQL queries
- Analysis
- Findings
- Recommendations
- Visualisations
- Lessons learned
Your portfolio should demonstrate what you can actually do.
Job-Readiness Support
Technical knowledge is important.
But professional readiness involves more than technical knowledge.
You may also need to understand:
- How to explain your projects
- How to communicate analytical findings
- How to discuss your technical skills
- How to approach interviews
- How to present your portfolio
- How to continue learning
Potenmunia’s approach therefore connects SQL for Data Analysis with broader professional development.
Industry Alignment
Technology changes.
Business needs change.
Data tools evolve.
AI continues to influence professional workflows.
Rather than focusing only on memorising a fixed list of commands, our approach encourages learners to develop adaptable problem-solving skills.
The objective is to help learners understand not only how SQL works, but how analytical thinking works.
Long-Term Career Vision
Learning SQL for Data Analysis should not necessarily be viewed as the final destination.
It can be one part of a longer technology journey.
You may eventually explore:
SQL → Data Analysis → Business Intelligence → Advanced Analytics → Data Science
or combine SQL with:
Excel + Power BI + Python + AI
The right path depends on your goals.
At Potenmunia Tech School, we encourage learners to think about where their skills can take them over the next several years—not simply what happens after completing a course.
We Build Competence, Not Just Certificates
This is one of the strongest principles behind the Potenmunia learning experience.
A certificate can show that someone completed a programme.
Competence demonstrates what someone can actually do.
For SQL for Data Analysis, competence means being able to:
- Understand databases
- Write SQL queries
- Filter data
- Aggregate data
- Join tables
- Analyse trends
- Solve analytical problems
- Explain findings
- Build projects
- Showcase your work
That is the difference between learning SQL theoretically and developing practical SQL capability.
A Complete SQL for Data Analysis Roadmap
If you are starting today, follow this progression.
1. Understand Databases
Learn:
- Database
- Table
- Row
- Column
- Primary key
- Foreign key
- Relationships
2. Learn SQL Fundamentals
Learn:
- SELECT
- FROM
- DISTINCT
- LIMIT
3. Learn Filtering
Learn:
- WHERE
- AND
- OR
- IN
- BETWEEN
- LIKE
- NULL
4. Learn Sorting
Learn:
- ORDER BY
- ASC
- DESC
5. Learn Aggregation
Learn:
- COUNT
- SUM
- AVG
- MIN
- MAX
6. Learn Grouping
Learn:
- GROUP BY
- HAVING
7. Learn JOINs
Learn:
- INNER JOIN
- LEFT JOIN
- RIGHT JOIN
- FULL OUTER JOIN
8. Learn Data Transformation
Learn:
- CASE
- String functions
- Date functions
- NULL handling
9. Learn Advanced SQL
Learn:
- Subqueries
- CTEs
- Window functions
- Ranking
- Running totals
10. Build Projects
Work with realistic datasets.
11. Build Your Portfolio
Document what you have done.
12. Prepare for Opportunities
Develop:
- Communication
- Interview skills
- Professional confidence
- Portfolio presentation
- Career direction
Common SQL for Data Analysis Mistakes Beginners Should Avoid
1. Memorising Without Understanding
Do not simply memorise SQL commands.
Understand why you are using them.
2. Avoiding Practical Projects
Projects help connect SQL syntax to real problems.
3. Being Afraid of JOINs
JOINs may seem difficult initially, but they are essential for working with relational data.
4. Ignoring Data Quality
Always investigate the quality of your data.
5. Depending Entirely on AI
AI can help you learn and work faster, but you should understand and verify the SQL it produces.
6. Focusing Only on Certificates
Certificates have their place, but practical evidence of ability is also important.
Frequently Asked Questions About SQL for Data Analysis
What is SQL for Data Analysis?
SQL for Data Analysis is the use of SQL to retrieve, filter, transform, combine and summarise data from databases to answer questions and generate useful insights.
Is SQL for Data Analysis difficult?
SQL can seem difficult at first, but beginners can learn it progressively by starting with basic queries and gradually moving into JOINs, aggregation, CTEs and window functions.
Can I learn SQL for Data Analysis without programming experience?
Yes. Beginners can learn SQL without previous programming experience.
What SQL commands should I learn first for data analysis?
Start with:
SELECT, FROM, WHERE, ORDER BY, GROUP BY, COUNT, SUM, AVG and JOIN.
Is SQL important for data analysts?
Yes. SQL is an important skill for working with structured data stored in relational databases.
Can SQL be used with Power BI?
Yes. SQL and business-intelligence tools can be part of the same data-analysis workflow.
Can AI replace SQL for Data Analysis?
AI can assist with SQL, but understanding SQL remains valuable because analysts need to verify queries, understand data structures and interpret results.
How long does it take to learn SQL for Data Analysis?
There is no universal timeframe. Your progress depends on your starting point, practice schedule, learning environment and the complexity of projects you undertake.
Where can I learn SQL for Data Analysis in Port Harcourt?
Learners looking for practical technology education in Port Harcourt can explore Potenmunia Tech School, where the learning approach emphasises practical training, mentorship, real-world projects, career readiness, AI integration and professional development.
Does Potenmunia Tech School focus only on certificates?
No.
The Potenmunia philosophy is centred on developing practical competence.
Our approach is:
Learn the skill. Practise the skill. Build with the skill. Showcase the skill. Prepare for the opportunity.
Conclusion on SQL for Data Analysis Is a Skill You Can Build
Learning SQL for Data Analysis is not about memorising hundreds of commands.
It is about learning how to think with data.
You begin with a question.
You identify the relevant data.
You write a query.
You examine the results.
You identify patterns.
You communicate what the data means.
Then you help turn that insight into a decision.
That is the real power of SQL for Data Analysis.
For beginners in Port Harcourt, Nigeria and beyond, the journey can start with something as simple as:
SELECT *
FROM customers;
But with consistent practice, that first query can eventually lead to complex analysis, practical projects, portfolio development and broader data skills.
At Potenmunia Tech School, our mission is not simply to help learners complete technology courses.
We want learners to develop practical capabilities they can continue building upon.
Our learning philosophy combines:
Practical Technology Training
Career & Income Readiness
Innovation & Entrepreneurship
AI & Future Skills Integration
Mentorship
Real-World Experience
Because we believe:
Learn the Skill. Practise the Skill. Build with the Skill. Showcase the Skill. Prepare for the Opportunity.
Potenmunia Tech School — Building Competence, Not Just Certificates.
AI for Beginners in Port Harcourt is the perfect starting point for anyone who wants to enter the world of Artificial Intelligence without any prior coding or tech background. In 2026, you do not need to be a programmer to learn AI; you need the right roadmap, the right tools, and the right mentors.
If you are a student, graduate, corps member, business owner, or a 9-to-5 worker in Port Harcourt looking to future-proof your career, this complete learning roadmap will show you everything you need to know to go from zero to job-ready in AI.
Table of Contents
- What is AI for Beginners in Port Harcourt?
- Why Port Harcourt is the Best City to Start Your AI Journey in 2026
- Complete 7-Step Learning Roadmap for AI for Beginners in Port Harcourt
- 5 Essential AI Tools Every Beginner Must Learn
- Career Opportunities After Learning AI for Beginners in Port Harcourt
- Why Potenmunia Tech School is the Best Place to Learn AI for Beginners in Port Harcourt
- Conclusion and FAQs

What is AI for Beginners in Port Harcourt?
AI for Beginners in Port Harcourt is a simplified, practical approach to learning Artificial Intelligence that focuses on using AI tools to solve real problems, not on building complex algorithms from scratch.
According to Wikipedia, Artificial Intelligence is intelligence demonstrated by machines, as opposed to natural intelligence displayed by humans. You can read more here: https://en.wikipedia.org/wiki/Artificial_intelligence
For a beginner, this means learning how to use tools like ChatGPT, Claude, and Canva AI to automate tasks, create content, analyze data, and help businesses grow. You do not need to learn advanced mathematics. You need to learn how to think smart and apply AI practically.
Why Port Harcourt is the Best City to Start Your AI Journey in 2026
Port Harcourt is no longer just an oil and gas city. It is fast becoming a business and tech hub. Thousands of SMEs in GRA, Trans-Amadi, Eliozu, and Peter Odili Road need AI-powered solutions for customer service, marketing, and sales. By learning AI for Beginners in Port Harcourt, you are positioning yourself to serve this massive, untapped market before the competition becomes too high.
Complete 7-Step Learning Roadmap for AI for Beginners in Port Harcourt
This is the exact roadmap we use at Potenmunia Tech School to take complete beginners to professional level:
Step 1: Understand the Fundamentals of AI (Week 1-2)
You will start by understanding what AI is, what it is not, the difference between Generative AI, Automation, and Machine Learning, and how businesses in Nigeria are already using it. This foundation removes fear and confusion.
Step 2: Master Prompt Engineering (Week 3-4)
This is the most important skill for any beginner. You will learn how to talk to AI tools like ChatGPT and Claude to get accurate, powerful results. You will learn the art of writing prompts that create business plans, marketing strategies, and professional emails.
Step 3: Learn AI for Content and Business Communication (Week 5-6)
Here, you will learn how to use Canva Magic Studio, ChatGPT, and other tools to create 30 days of social media content in 2 hours, write professional proposals, and design presentations that win clients.
Step 4: Learn Business Automation for Beginners (Week 7-8)
This is where you move from user to expert. You will learn how to use no-code tools like Zapier and Make.com to automate repetitive tasks. For example, you will learn how to automatically save Instagram inquiries to Google Sheets or send automatic WhatsApp replies to customers.
Step 5: Learn AI for Data and Research (Week 9-10)
You will learn how to use AI to analyze sales data, research competitors, and make smart business decisions without needing to be a data scientist. This skill alone makes you valuable to any business owner in Port Harcourt.
Step 6: Build Your 3 Real-World Portfolio Projects (Week 11-13)
Theory without projects is useless. You will build three complete, real-world projects: 1. A 24/7 AI Customer Support Assistant for a fashion business. 2. An Automated Content Creation System for a real estate brand. 3. A Business Data Analysis Dashboard for sales performance.
Step 7: Career Launch and Monetization (Week 14-16)
You will learn how to package your skills, rewrite your CV, optimize your LinkedIn profile, and start applying for jobs as an AI Virtual Assistant, Automation Specialist, or Freelancer on Upwork. We show you how to start earning from your AI for Beginners in Port Harcourt training.
Learn more about our beginner-friendly training structure here [Insert internal link to your AI Training Cost blog post].

Why Potenmunia Tech School is the Best Place to Learn AI for Beginners in Port Harcourt
Many schools offer AI training, but Potenmunia Tech School was built specifically for beginners who want real competence, not just a certificate. Our training for AI for Beginners in Port Harcourt is built on six pillars that guarantee your success:
1. 100% Practical Training, Zero Confusing Theory
What we do: We know beginners get scared by too much theory and coding. That is why we teach zero coding. Every class is 100% practical. You will be on your laptop, with a live instructor guiding you step-by-step. We explain every tool in simple, everyday English, so even if you have never used AI before, you will understand and practice immediately.
2. Career and Income Focus From Day One
What we do: We do not teach AI for fun. From your first class, we show you how to turn what you learn into income. We show you how to use your beginner AI skills to get jobs in Port Harcourt companies, to help business owners automate their work, and to start freelancing for international clients. Every lesson is tied to a real income opportunity.
3. Innovation Mindset, Not Button Memorization
What we do: Tools will change, but mindset remains. We teach you how to think like a problem solver. We teach you how to look at a struggling business in Mile 4 Market or an online vendor on Instagram and identify how AI can double their sales or save them 10 hours every week. This innovative thinking is what makes our students stand out as leaders, not just tool users.
4. Future-Ready Curriculum Updated Monthly
What we do: The AI world moves fast. What worked in 2024 no longer works in 2026. Our curriculum for AI for Beginners in Port Harcourt is updated every single month. We teach you the latest versions of ChatGPT-4o, Claude 3.5, Gemini 1.5, and new no-code automation workflows, so you are always learning what is currently relevant and in-demand.
5. Mentorship Ecosystem With Direct Access to Instructors
What we do: This is the heart of Potenmunia. As a beginner, you will have questions and you will get stuck. You are not left alone. You get direct access to your instructors through our dedicated mentorship community on WhatsApp and in-person. We hold weekly Q&A sessions, project review sessions, and one-on-one guidance to ensure no beginner is left behind. This is why our completion rate is over 95%.
6. Real-World Project Experience and Job Support
What we do: You will not graduate with only theory. You will graduate with three working, real-world AI solutions that you built yourself. We then help you host these projects, create a professional portfolio website, rewrite your CV to highlight your new AI skills, and optimize your LinkedIn profile. We teach you exactly how to apply for jobs and freelance gigs with your new AI for Beginners in Port Harcourt certificate and portfolio.
Conclusion
Starting your journey with AI for Beginners in Port Harcourt is one of the smartest career decisions you can make in 2026. By following a clear 7-step roadmap and learning through a trusted institution like Potenmunia Tech School, you can go from a complete beginner with zero tech background to a confident, job-ready AI professional in less than four months. The opportunities in the tech space are expanding fast, take that first step today, stay consistent, and position yourself at the forefront of the modern digital economy.
FAQs
Do I need a laptop or coding knowledge to start AI for Beginners in Port Harcourt?
You need a laptop, but you do not need any coding knowledge. Our beginner program is 100% no-code and practical.
How long does it take to complete AI for Beginners in Port Harcourt at Potenmunia?
Our complete beginner-to-professional roadmap takes 16 weeks, including mentorship and portfolio building.
AI Training Cost in Port Harcourt is the first and most important question you should ask before enrolling for any Artificial Intelligence program in 2026. However, focusing only on the price without understanding what you are paying for is the reason many students in Port Harcourt waste money on trainings that give them a certificate but no real skill.
At Potenmunia Tech School, we believe transparency is the foundation of trust. That is why this detailed guide will not just tell you the price, but will break down what makes up the AI Training Course in Port Harcourt, the hidden fees other schools will not tell you, and how to know if you are making a wise investment.
Table of Contents
- What is the Average AI Training Cost in Port Harcourt in 2026?
- Why AI Training Cost in Port Harcourt Varies From School to School
- 5 Hidden Fees You Must Ask About Before You Pay
- How Potenmunia Justifies Its AI Training Cost in Port Harcourt: What You Actually Get
- What a Professional AI Training Must Include for Its Price
- Conclusion and FAQs

What is the Average AI Training Cost in Port Harcourt in 2026?
As of 2026, the average AI Training Cost in Port Harcourt ranges from ₦70,000 to ₦400,000. This wide range exists because not all trainings are the same.
According to Wikipedia, Artificial Intelligence is the development of computer systems able to perform tasks that normally require human intelligence. You can read the full definition here: https://en.wikipedia.org/wiki/Artificial_intelligence
A low-cost training of ₦70,000 to ₦100,000 is typically a pre-recorded video course with no mentorship, no projects, and no career support. A mid-range to premium training of ₦150,000 to ₦350,000 is a full mentorship-driven program with practical classes, real projects, and job-readiness support. Understanding this difference is the key to understanding the real AI Training Cost in Port Harcourt.
Why AI Training Cost in Port Harcourt Varies From School to School
The AI Training Cost in Port Harcourt is determined by four major factors:
1. Mode of Learning: A physical classroom training in areas like GRA, Peter Odili Road, or Eliozu with stable power, high-speed internet, and a live instructor will cost more than an online-only video course where you bear the cost of data and fuel yourself.
2. Curriculum Depth: A 2-week course that only teaches ChatGPT basics will be cheaper than a 16-week program that teaches prompt engineering, business automation with Zapier and Make.com, AI content systems, data analysis, and portfolio development.
3. Level of Mentorship: This is the most critical factor. Cheap courses end after you pay. Quality programs include 4 to 6 months of direct access to instructors, a community for questions, and one-on-one guidance when you are stuck. This mentorship is what determines your success.
4. Portfolio and Career Support: Does the school help you build a portfolio and prepare you for jobs? Schools that do this invest more time and resources, which is reflected in the AI Training Cost in Port Harcourt.

5 Hidden Fees You Must Ask About Before You Pay Any AI Training Cost in Port Harcourt
Many students discover these extra costs after they have already paid. Ask these questions before you enroll:
1. Tool Subscription Fees: Some schools advertise a low fee but later ask you to pay ₦20,000 monthly for ChatGPT Plus, Canva Pro, and automation tools. Always ask if tool guidance for both free and paid versions is included.
2. Certificate Collection Fee: Some centers in Port Harcourt charge an extra ₦10,000 to ₦20,000 for certificate printing. Confirm if your certificate is included in the initial AI Training Cost in Port Harcourt.
3. Internet and Power Costs: For online-only trainings, you will spend heavily on data. A good physical school includes power and internet in its fee.
4. Project Support Fee: Some schools teach theory but charge you extra if you want help building real portfolio projects. A complete training must include project building in its fee.
5. Cost of Retraining: This is the most expensive hidden cost. If you pay for a cheap training that gives you no competence, you will have to pay again for another school. The cheapest training is often the most expensive in the long run.
AI Training Cost in Port Harcourt: Inside Potenmunia’s 6-Pillar System
At Potenmunia Tech School, our AI Training Cost in Port Harcourt is not just a fee; it is an investment in competence and career results. We do not give you just videos and a certificate. We give you a complete system built on six pillars:
1. 100% Practical Training, Not Theory
What we do: Every class at Potenmunia is a live, practical workshop. You will not sit and watch an instructor press buttons. You will be on your own laptop, working alongside the instructor, building AI automation systems, creating content calendars with AI, and analyzing real business data in real-time. Our model ensures that by the end of your training, you have spent over 80% of your time practicing, which is what builds true confidence and skill.
2. Career and Income Focus From Day One
What we do: From the first week, we do not teach AI as abstract knowledge. We teach it as a tool for income. We show you exactly how to use the skills to become an AI-Powered Virtual Assistant, a Business Automation Specialist for SMEs in Trans-Amadi, or a Freelance AI Consultant on Upwork and Fiverr. Every project you build is carefully designed to solve a real Port Harcourt business problem and to be added directly to your professional portfolio.
3. Innovation Mindset, Not Memorization
What we do: AI tools change every month. If we only teach you how to click buttons in ChatGPT, your skill will be outdated in 3 months. Instead, we teach you how to think like an innovator. We teach you how to look at any business challenge, whether it is poor customer service, slow content creation, or poor sales analysis, and design an AI-powered solution for it. This mindset ensures you remain relevant no matter how the tools evolve.
4. Future-Ready Curriculum Updated Monthly
What we do: Many schools in Port Harcourt are still teaching a 2023 curriculum. Our curriculum team updates our training content every month to include the latest tools and workflows, including GPT-4o, Claude 3.5 Sonnet, Google Gemini 1.5, Canva Magic Studio, and advanced automation with Make.com. When you pay the AI Training Cost in Port Harcourt at Potenmunia, you are paying for what is working right now in 2026, not what worked two years ago.
5. Mentorship Ecosystem With Direct Access to Instructors
What we do: This is where we are completely different. You are not abandoned after class. You are added to a dedicated mentorship community where you have direct access to your instructors. If you are building a project at 9 PM and you are stuck, you can ask a question and get guidance. We also hold weekly review sessions, CV clinics, and LinkedIn optimization sessions to ensure you are not just learning, but growing. This ecosystem is the reason our students complete their training and get results.
6. Real-World Project Experience and Job-Readiness Support
What we do: You will not build dummy projects. You will build 3 to 5 real, working solutions for real businesses. You will build a fully functional AI Customer Support Assistant for WhatsApp and Instagram, an automated 30-day Content Generation System for a fashion or food business, and a Sales Analysis Dashboard powered by AI. After building, we help you host these projects professionally, rewrite your CV to highlight your AI skills, and optimize your LinkedIn profile to attract both local companies in Port Harcourt and international remote clients.
Learn more about our practical training model and student success stories here: https://www.potenmuniatechschool.com
Conclusion
When you evaluate the AI Training Cost in Port Harcourt, do not ask “Who is the cheapest?” Ask “Who will make me competent, give me real projects, and support my career?” The most affordable training is not the one with the lowest price tag, but the one that gives you a skill you can use to make money for the next 10 years.
FAQs
Is the AI Training Cost in Port Harcourt affordable for students?
Yes, at Potenmunia we offer flexible installment payment plans to make our program accessible to students and NYSC corps members.
Does your AI Training Cost in Port Harcourt include a certificate?
Yes, your professional certificate, portfolio building, and career support are all included in one transparent fee with no hidden charges.
Data Analyst Training in Port Harcourt is an excellent way for beginners, students, graduates, professionals, entrepreneurs, and career changers to develop practical technology skills for the digital economy.
Today, organizations generate large amounts of data. However, data becomes valuable when professionals can organize it, analyze it, and turn it into useful insights. This is where a skilled data analyst can make a difference.
For anyone searching for Data Analyst Training in Port Harcourt, choosing the right learning environment is important. A good programme should not focus only on lectures and certificates. Instead, learners should have opportunities to practise, complete projects, build portfolios, develop professional confidence and understand how their skills can be applied in real-world situations.
At Potenmunia Tech School, our approach to Data Analyst Training in Port Harcourt is built around practical learning, career readiness, innovation, artificial intelligence, mentorship and real-world experience.
Our goal is simple:

Learn the skill. Practise the skill. Build with the skill. Showcase the skill. Prepare for the opportunity.
What Is Data Analyst Training in Port Harcourt?
Data Analyst Training in Port Harcourt is a structured learning process that teaches students how to collect, clean, organize, analyze, visualize and interpret data.
The training can introduce learners to important data analysis tools and concepts, including:
- Microsoft Excel
- SQL
- Power BI
- Python
- Data visualization
- Data cleaning
- Data reporting
- Data interpretation
- Business intelligence
- AI-assisted productivity
Rather than simply learning software, effective Data Analyst Training in Port Harcourt should help students understand how these tools can be used to solve practical problems.
For example, a business may have thousands of sales records but not know which products are performing best. A data analyst can clean the information, analyze the numbers and create a dashboard that makes the findings easier to understand.
Why Data Analyst Training in Port Harcourt Matters
Port Harcourt is an important commercial and professional environment in Rivers State. Businesses, organizations and professionals increasingly interact with digital information.
As technology continues to influence different industries, people who understand how to work with data can develop useful skills for modern workplaces.
This makes Data Analyst Training in Port Harcourt relevant to people interested in industries such as:
- Oil and gas
- Banking and finance
- Healthcare
- Education
- Retail
- Marketing
- Logistics
- Telecommunications
- Technology
- Entrepreneurship
- Business management
The benefit of learning data analysis is that the skill can be applied across different industries.
Who Needs Data Analyst Training in Port Harcourt?
Data Analyst Training in Port Harcourt is not limited to people who already work in technology.
The training can be useful for:
Students
Students can develop technology skills while building practical projects that demonstrate what they have learned.
Graduates
Graduates can add data analysis skills to their existing educational background and develop a stronger professional profile.
Working Professionals
Professionals can learn how data tools can improve reporting, decision-making and productivity in their existing careers.
Entrepreneurs
Business owners can learn how to use data to understand customers, sales, expenses and business performance.
Career Changers
People interested in moving into technology can use structured Data Analyst Training in Port Harcourt as a pathway toward developing relevant skills.
Aspiring Remote Professionals
Learners interested in remote digital opportunities can develop practical analytical skills that may be applicable to different professional environments.
What You Learn in Data Analyst Training in Port Harcourt
A strong Data Analyst Training in Port Harcourt programme should provide a progressive learning experience.
At Potenmunia Tech School, learners can build their understanding through practical technology training.
1. Microsoft Excel for Data Analysis
Excel is an important starting point for many beginners.
Through practical Data Analyst Training in Port Harcourt, learners can develop Excel skills such as:
- Data entry
- Data organization
- Sorting
- Filtering
- Formulas
- Functions
- Pivot tables
- Charts
- Basic dashboards
- Data cleaning
For example, learners could use Excel to analyze monthly sales records and determine which products generated the highest revenue.
2. SQL for Data Analysis
SQL is another important skill for data professionals.
Through Data Analyst Training in Port Harcourt, learners can develop an understanding of how SQL is used to retrieve and analyze information stored in databases.
Topics can include:
- SELECT statements
- WHERE conditions
- Sorting
- Filtering
- Aggregation
- GROUP BY
- JOIN operations
- Database queries
SQL helps analysts work with larger structured datasets.
3. Power BI
Power BI is useful for creating interactive reports and dashboards.
In practical Data Analyst Training in Port Harcourt, learners can explore:
- Data importing
- Data transformation
- Data modelling
- Charts
- Dashboards
- Reports
- Interactive visualizations
- Business insights
A Power BI dashboard can help transform complex information into an easier-to-understand visual format.
4. Python for Data Analysis
Python can provide learners with additional analytical capabilities.
A Data Analyst Training in Port Harcourt programme that introduces Python can help learners understand:
- Data manipulation
- Data cleaning
- Exploratory data analysis
- Automation
- Data visualization
- Working with datasets
Python can become particularly useful as learners progress into more advanced data-related work.
Data Analyst Training in Port Harcourt: From Beginner to Practical Professional
One of the most important parts of learning data analysis is understanding the difference between knowing a concept and being able to apply it.
At Potenmunia Tech School, Data Analyst Training in Port Harcourt follows a practical progression.
Step 1: Learn
Learners begin by understanding fundamental data concepts.
Step 2: Practise
Learners apply those concepts using different tools and exercises.
Step 3: Build
Learners work on practical projects based on realistic problems.
Step 4: Showcase
Learners organize suitable projects into a professional portfolio.
Step 5: Prepare
Learners develop professional skills and prepare for potential career opportunities.
This creates a learning journey that goes beyond simply completing lessons.
What Makes Potenmunia Tech School Different?
When choosing Data Analyst Training in Port Harcourt, learners should ask an important question:
Will the training help me develop practical competence?
At Potenmunia Tech School, our answer is based on a practical learning philosophy.
Practical Technology Training
Our Data Analyst Training in Port Harcourt emphasizes hands-on learning.
Students do not simply listen to instructors. They practise tools, techniques and workflows that can help them understand how data analysis works in real-world environments.
Career and Income Readiness
Learning data analysis can create different professional possibilities.
Our approach helps learners understand how technical skills can potentially be applied to:
- Employment
- Remote work
- Freelancing
- Consulting
- Entrepreneurship
- Business projects
The focus is on developing useful capabilities rather than making unrealistic promises about guaranteed income.
Innovation and Entrepreneurship
Data analysis can be used to solve business problems.
At Potenmunia Tech School, learners are encouraged to think beyond simply finding a job.
They can explore how technology, data and AI can be used to create:
- Business solutions
- Products
- Digital services
- Innovative ideas
- New opportunities
AI and Future Skills Integration
Artificial Intelligence is becoming increasingly important in professional environments.
Our approach to Data Analyst Training in Port Harcourt therefore recognizes the importance of understanding how AI tools can support:
- Productivity
- Research
- Data-related workflows
- Problem-solving
- Business processes
- Professional work
AI is treated as a productivity and problem-solving tool rather than a replacement for fundamental analytical understanding.
Mentorship Ecosystem
Learning does not end when a class finishes.
Mentorship can help learners understand their progress, identify skill gaps and make better decisions about their professional direction.
Real-World Experience
A major part of our approach is practical project experience.
Learners are encouraged to apply their skills to realistic problems so that they can develop stronger confidence and practical capability.
The Potenmunia Learning Experience
100% Practical Learning
Our approach to Data Analyst Training in Port Harcourt emphasizes learning by doing.
Students spend significant time applying concepts instead of depending entirely on theoretical instruction.
One-on-One Mentorship
Where applicable, learners can receive personalized guidance to help them identify gaps and improve their skills.
Real Project Experience
Projects give learners an opportunity to demonstrate how they can apply data analysis tools to practical problems.
Career Portfolio Building
A professional portfolio can demonstrate what a learner can actually do.
For example, a learner could develop projects involving:
- Sales analysis
- Customer analysis
- Business performance
- Marketing data
- Financial reporting
- Interactive dashboards
Job-Readiness Support
Technical knowledge is only one part of career development.
Our approach also emphasizes:
- Professional confidence
- Portfolio presentation
- Communication
- Interview preparation
- Career direction
- Workplace awareness
AI Integration and Interview Preparation
Learners are encouraged to understand how AI can support modern professional workflows while also preparing for interviews and professional conversations.
Industry Alignment
The technology industry continues to change.
Therefore, Data Analyst Training in Port Harcourt should help learners develop skills that remain relevant to modern digital work environments.
Long-Term Career Vision
Completing a data analyst course should not be viewed as the final destination.
Learners should also consider how their skills can develop over the next several years.
This long-term approach encourages continuous learning and professional growth.
Why Practical Projects Matter in Data Analyst Training in Port Harcourt
Imagine a learner completes lessons on Excel, SQL and Power BI but has never worked on a practical dataset.
The learner may understand the theory but struggle when asked to solve an unfamiliar problem.
Projects help close this gap.
For example, a practical Data Analyst Training in Port Harcourt project could involve a fictional Port Harcourt retail company.
The dataset might contain:
- Product names
- Customer information
- Sales records
- Revenue
- Expenses
- Locations
- Monthly transactions
The learner could then:
- Clean the dataset.
- Analyze the information.
- Identify trends.
- Create charts.
- Build a dashboard.
- Explain the findings.
- Present recommendations.
This type of project provides practical evidence of what the learner can do.
Building a Data Analyst Portfolio in Port Harcourt
One important outcome of effective Data Analyst Training in Port Harcourt is learning how to build a portfolio.
A portfolio can contain selected projects that demonstrate practical competence.
For example:
Sales Dashboard
Analyze product sales and monthly revenue.
Customer Analysis
Identify customer purchasing patterns.
Business Expense Analysis
Examine expenses and identify important trends.
Marketing Analysis
Analyze campaign performance and compare different marketing channels.
Business Intelligence Dashboard
Combine multiple data sources into an interactive dashboard.
These projects can help learners demonstrate practical skills to potential employers or clients.
Data Analyst Career Opportunities
After completing Data Analyst Training in Port Harcourt, learners may explore different data-related career paths depending on their skills, experience and professional goals.
Potential roles include:
- Junior Data Analyst
- Data Analyst
- Business Intelligence Analyst
- Reporting Analyst
- Business Analyst
- Operations Analyst
- Marketing Data Analyst
- Data Visualization Specialist
However, training alone does not guarantee employment.
Professional opportunities can depend on practical skills, portfolio quality, communication, interview performance, experience and employer requirements.
This is why Potenmunia Tech School focuses on job readiness as well as technical training.
Why Choose Potenmunia Tech School for Data Analyst Training in Port Harcourt?
If you are comparing different options for Data Analyst Training in Port Harcourt, consider the complete learning experience rather than looking only at the course name.
Ask whether the programme provides:
- Practical training
- Real projects
- Mentorship
- Portfolio development
- Career guidance
- AI integration
- Interview preparation
- Industry alignment
- Professional development
Potenmunia Tech School brings these areas together.
Our focus is to help learners develop the ability to use their skills, demonstrate their work and continue growing professionally.
We build competence, not just certificates.
Data Analyst Training in Port Harcourt: Frequently Asked Questions
What is Data Analyst Training in Port Harcourt?
Data Analyst Training in Port Harcourt is a structured programme designed to teach learners how to work with data using tools such as Excel, SQL, Power BI and Python.
Where can I learn Data Analyst Training in Port Harcourt?
Potenmunia Tech School provides a practical learning approach for people interested in developing data analysis skills in Port Harcourt.
Is Data Analyst Training in Port Harcourt suitable for beginners?
Yes. Beginners can start with foundational concepts and gradually develop their skills through structured lessons and practical projects.
What tools are taught in Data Analyst Training in Port Harcourt?
Depending on the programme structure, learners can develop skills around tools such as Excel, SQL, Power BI and Python, alongside data visualization and analytical concepts.
Can I learn data analysis without a technical background?
Yes. A beginner-friendly learning pathway can introduce data concepts gradually before progressing to more advanced tools.
Is a certificate enough to become a data analyst?
No. A certificate can demonstrate programme completion, but practical projects, portfolio evidence, problem-solving ability and professional preparation are also valuable.
How long does Data Analyst Training in Port Harcourt take?
The duration depends on the specific programme structure, learning schedule and learner’s pace. The quality of practice and project experience is also important.
Can data analysts work remotely?
Some data-related roles may offer remote or hybrid opportunities. However, availability depends on employers, role requirements, experience and the candidate’s skills.
Can data analysis be used in Port Harcourt businesses?
Yes. Data analysis can support areas such as sales, marketing, finance, operations, customer analysis and business reporting.
What makes Potenmunia Tech School different?
Potenmunia Tech School combines practical technology training with real project experience, mentorship, portfolio development, AI integration, career preparation, innovation and long-term professional development.
Conclusion on Data Analyst Training in Port Harcourt
Data Analyst Training in Port Harcourt can provide a strong foundation for people who want to develop practical data and technology skills.
However, learning data analysis should go beyond watching lessons and collecting certificates.
Learners need opportunities to practise their skills, solve realistic problems, build projects, create portfolios and prepare for professional environments.
That is the philosophy behind Potenmunia Tech School.
Our approach combines:
- Practical technology training
- Career and income readiness
- Innovation and entrepreneurship
- AI and future skills
- Mentorship
- Real-world projects
- Portfolio development
- Job-readiness support
- Industry alignment
- Long-term career vision
The ultimate objective is not simply to say that you completed Data Analyst Training in Port Harcourt.
The objective is to develop the competence and confidence to demonstrate what you can actually do.
Learn the skill. Practise the skill. Build with the skill. Showcase the skill. Prepare for the opportunity.
Potenmunia Tech School — building competence, not just certificates.
Generative AI Course Port Harcourt is the fastest way to move from just using AI to earning with AI in 2026. In the last two blogs, we talked about AI Jobs and how to create with AI. In this detailed guide, we will break down everything you will actually learn inside a professional Generative AI Course Port Harcourt, the skills, the tools, and the real career opportunities waiting for you after graduation.
If you are a student, business owner, 9-to-5 worker, or job seeker in Port Harcourt, this guide will give you the complete roadmap of what to expect and why Potenmunia Tech School offers the best Generative AI Course Port Harcourt in Rivers State.
Table of Contents
- What You Will Really Learn in a Generative AI Course Port Harcourt
- 7 High-Income Skills You Will Master
- 10 Professional Tools You Will Master (And What Each Tool Does)
- Complete 16-Week Learning Roadmap at Potenmunia
- Career and Business Opportunities After Generative AI Course Port Harcourt
- Who Should Enroll for Generative AI Course Port Harcourt?
- Why Potenmunia Tech School is the Best Place for Generative AI Course Port Harcourt – 6-Pillar Breakdown
- Conclusion and FAQs

1. What You Will Really Learn in a Generative AI Course Port Harcourt
A standard Generative AI Course Port Harcourt is not about theory. According to Wikipedia, Generative AI is a system that can generate new content like text, images, video and music. Read more here: https://en.wikipedia.org/wiki/Generative_artificial_intelligence
A professional Generative AI Course Port Harcourt teaches you how to use that system to solve real business problems in Port Harcourt. You will not just learn how to chat with AI, you will learn how to instruct AI to create professional brand designs, viral videos, sales content, and automated business systems that companies pay for.
2. 7 High-Income Skills You Will Master in Generative AI Course Port Harcourt
Skill 1: Advanced Prompt Engineering
This is the number one skill. It is the art of talking to AI to get perfect results. In our Generative AI Course Port Harcourt, you will learn our 5-part prompt formula: Role + Task + Context + Format + Example. With this, you will get 10x better results than someone who just says “create a logo”. This skill alone can earn you $50 per prompt pack on international platforms.
Skill 2: AI-Powered Graphic and Brand Design
You will learn how to create professional logos, flyers, product photos, business cards, and complete brand identities using AI. No more Canva templates that everyone uses. You will create original designs that look like a ₦100k agency did it.
Skill 3: AI Video Creation and Editing
You will learn how to generate viral TikTok, Reels, and YouTube Shorts from ordinary text. You will learn how to create product adverts, explainer videos, and real estate video tours without a camera or studio. This is one of the most in-demand skills after a Generative AI Course Port Harcourt.
Skill 4: AI Content Strategy and Copywriting
You will learn how to use AI to generate 30 days of social media content ideas, captions, hashtags, and sales copies that actually sell. You will learn how businesses in Eliozu and GRA use this skill to make more sales without hiring a content team.
Skill 5: AI Voiceover and Audio Creation
You will learn how to create professional human-sounding voiceovers for adverts, YouTube videos, and presentations using ElevenLabs. No need to hire a voiceover artist for ₦10k per voiceover again.
Skill 6: AI Workflow Automation
You will learn how to connect different AI tools together. For example, how to automatically take a business idea from ChatGPT to an image in Midjourney to a video in Runway to a scheduled post. This automation skill is what makes you a pro after your Generative AI Course Port Harcourt.
Skill 7: AI Portfolio Building and Monetization
You will learn how to package all your skills into a professional portfolio website and how to turn it into money. We teach you how to price your services, how to pitch to clients in Port Harcourt and how to get foreign clients on Upwork and Fiverr.

3. 10 Professional Tools You Will Master (And What Each Tool Does)
In our Generative AI Course Port Harcourt at Potenmunia Tech School, you will not learn 1 or 2 tools. You will master 10 industry-standard tools:
- ChatGPT-4o & Claude 3.5: Your brainstorming partners for ideas, business plans, and sales copies.
- Midjourney v6: For ultra-realistic images, fashion designs, and product photography.
- Leonardo AI & DALL-E 3: For commercial-use images and brand assets.
- Canva Magic Studio: For fast professional designs for Nigerian businesses.
- Runway Gen-3 & Pika Labs: For turning text into professional advert videos.
- ElevenLabs: For 100% human-like voiceovers in English, Pidgin, and other accents.
- InVideo AI & CapCut AI: For automated video editing with auto-captions and effects.
4. Complete 16-Week Learning Roadmap at Potenmunia
Weeks 1-2: Foundation & Prompt Engineering
You will understand Generative AI, set up all tools, and master prompt engineering. You will practice with 50+ real business prompts from Port Harcourt businesses.
Weeks 3-6: AI Design Mastery
You will focus on images. You will create 15+ professional projects: logos for a restaurant in GRA, product photos for a fashion vendor in Mile 1, flyers for a real estate company in Peter Odili.
Weeks 7-10: AI Video & Voice Mastery
You will focus on video. You will create 10+ advert videos, including a video advert for a logistics company in Trans-Amadi and a property tour video for an estate in Eliozu.
Weeks 11-13: Content Factory & Automation
You will build a complete system that generates 30 days of content for a business in one day. This is the system our graduates use to charge ₦150k monthly for social media management.
Weeks 14-16: Portfolio, Pricing & Client Getting
You will build your portfolio website, learn how to write proposals, and we will do mock client pitching with you. You graduate ready to earn, not just with a certificate.
5. Career and Business Opportunities After Generative AI Course Port Harcourt
Job Opportunities: You can work as an AI Content Creator (₦200k – ₦500k monthly in Port Harcourt companies), AI Graphic Designer, AI Video Specialist, or Social Media Automation Manager. Oil and gas servicing companies in Onne and Trans-Amadi are now hiring for these roles.
Business Opportunities: Start your own AI Creative Agency. Offer a package: “We will create your business content with AI – 20 flyers + 10 videos + 30 captions for ₦150k per month”. Get just 8 clients and you are doing ₦1.2M monthly. You can also sell AI-generated templates and prompt packs internationally for $50 – $200.
6. Who Should Enroll for Generative AI Course Port Harcourt?
This Generative AI Course Port Harcourt is for: 1) Graphic Designers who want to work 10x faster, 2) Content Creators who want to create 30 days content in one day, 3) Business Owners who want to save ₦250k monthly on designers, 4) Students/NYSC who want to start earning immediately, 5) 9-to-5 workers who want to create world-class presentations, and 6) Complete beginners who can type and browse.
7. Why Potenmunia Tech School is the Best Place for Generative AI Course Port Harcourt
1. 100% Practical Training, Zero Boring Theory
What we do: In every class of our Generative AI Course Port Harcourt, your laptop is open and you are creating. You generate your first professional logo in day one, not week four. We learn by doing.
2. Career and Income Focus From Day One
What we do: We teach you to earn, not just to create. From day one of your Generative AI Course Port Harcourt, we show you real Fiverr and Upwork gigs where people are charging $100-$300 for AI design and video. We show you exactly how to replicate it and get clients.
3. Innovation Mindset, Not Tool Memorization
What we do: Tools will change. Midjourney will become Midjourney v10. We do not teach you to memorize buttons. We teach you how to think like an innovator. How to look at a business in Diobu with no online presence and instantly see how your skills from this Generative AI Course Port Harcourt can transform them into a premium brand.
4. Future-Ready Curriculum Updated Monthly
What we do: Our curriculum for Generative AI Course Port Harcourt is updated every month. We teach Midjourney v6, Runway Gen-3, and ChatGPT-4o, not old 2023 versions. You learn what works right now in 2026 and what clients are paying for.
5. Mentorship Ecosystem With Direct Access to Instructors
What we do: You do not learn alone. You get direct access to instructors in physical class and private WhatsApp group for your set. You submit your AI design, we give you live feedback, better prompts, and professional correction until it looks world-class. No student is left behind in our Generative AI Course Port Harcourt.
6. Real-World Project Experience and Job Support
What we do: You graduate with a portfolio of 25+ real projects for real businesses, not just class exercises. You build a live portfolio website, we rewrite your CV as an AI Creative Specialist, and we teach you how to apply for AI jobs in Port Harcourt and international freelance jobs. We also connect top students to businesses in our network.
Conclusion
Enrolling in a Generative AI Course in Port Harcourt is the most practical career investment you can make in 2026. This course equips you with high-demand skills that cut costs for businesses while opening new income streams for you. If you can type simple English, you can learn to create professional visual and written content like a pro.
Ready to transform your skills? Enroll in the Generative AI Course in Port Harcourt at Potenmunia Tech School today, check out our full course breakdown, and start your journey to becoming a certified AI Creator in just 16 weeks.
FAQs
Do I need prior design experience before taking the Generative AI Course in Port Harcourt?
No. This program is 100% beginner-friendly and requires zero coding experience. You will learn step-by-step how to generate professional graphics, videos, and written assets using basic text prompts.
How long is the Generative AI Course at Potenmunia Tech School?
Our complete program spans 16 weeks (approx. 4 months). This includes hands-on projects, personalized mentorship, portfolio development, and dedicated modules on client acquisition.
Do I need a high-end laptop for this course?
No. Most modern cloud-based AI applications run directly inside a standard web browser. You only need a basic laptop capable of internet browsing, a steady connection, and a desire to learn.
Will I receive a recognized certificate upon completion?
Yes. After successfully finishing the 16-week coursework and capstone projects, you will receive an official certification from Potenmunia Tech School to display on your resume and LinkedIn profile.